
Metric time series correlation by outlier removal based on maximum concentration interval

a technology of maximum concentration interval and correlation relationship, applied in the field of metric time series correlation by maximum concentration interval, can solve the problems of error conditions, affecting metrics, response time could drop to just 20 milliseconds, etc., and achieve the effect of improving the correlation relationship and improving the correlation of metric time series

Inactive Publication Date: 2016-03-31
ORACLE INT CORP
View PDF1 Cites 42 Cited by
  • Summary
  • Abstract
  • Description
  • Claims
  • Application Information

AI Technical Summary

Benefits of technology

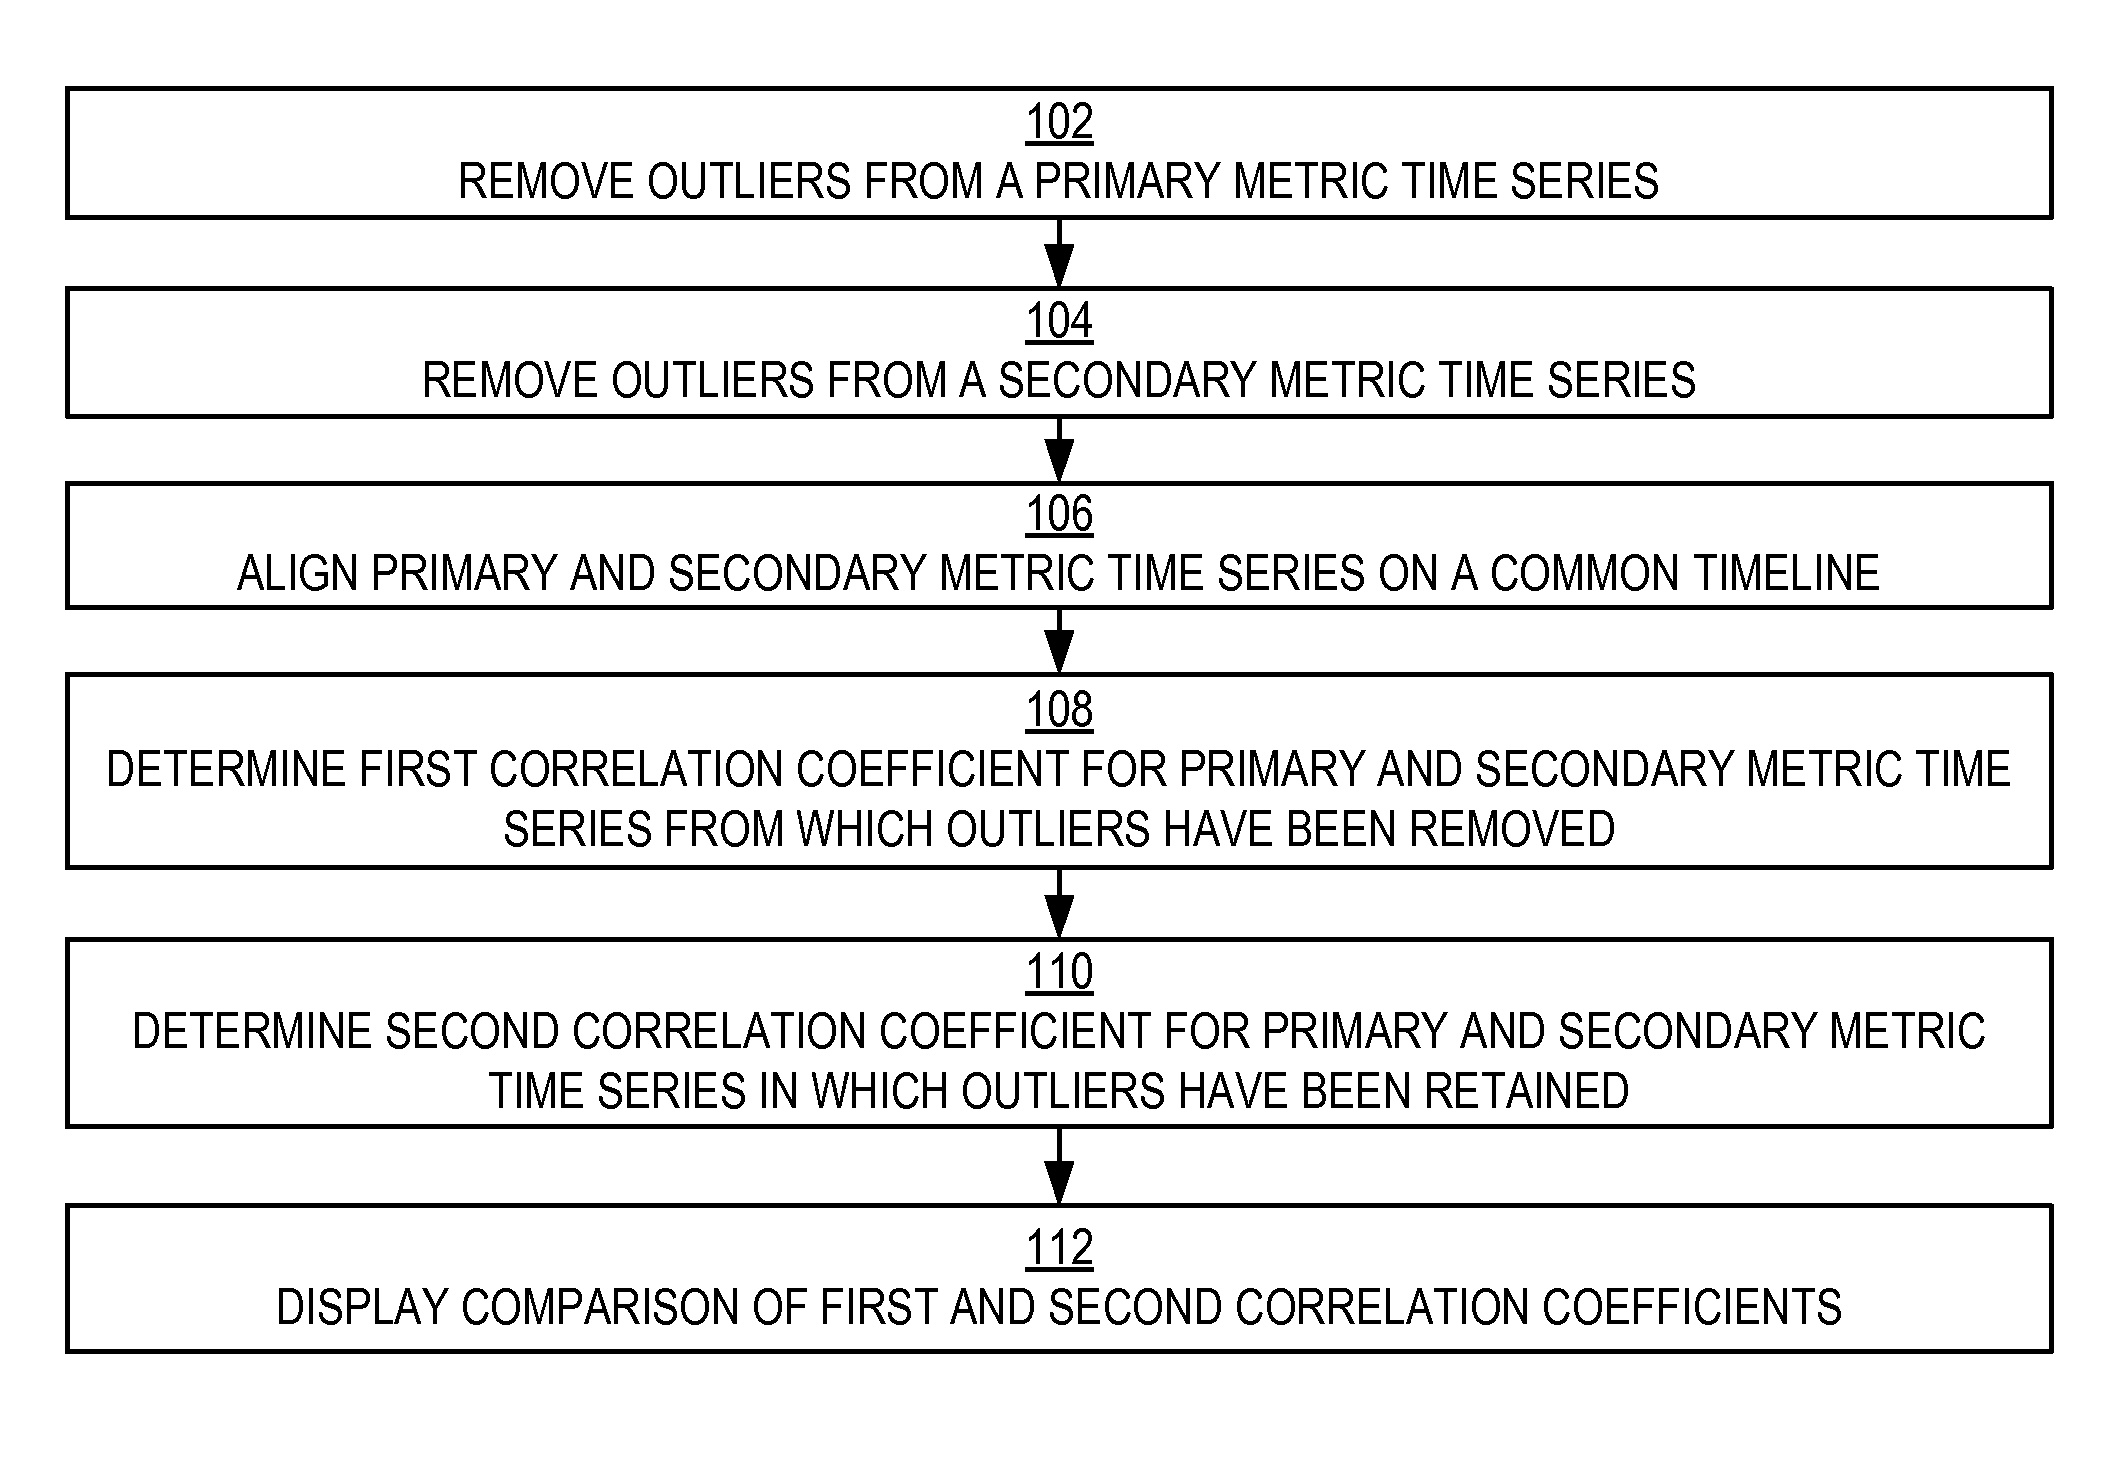
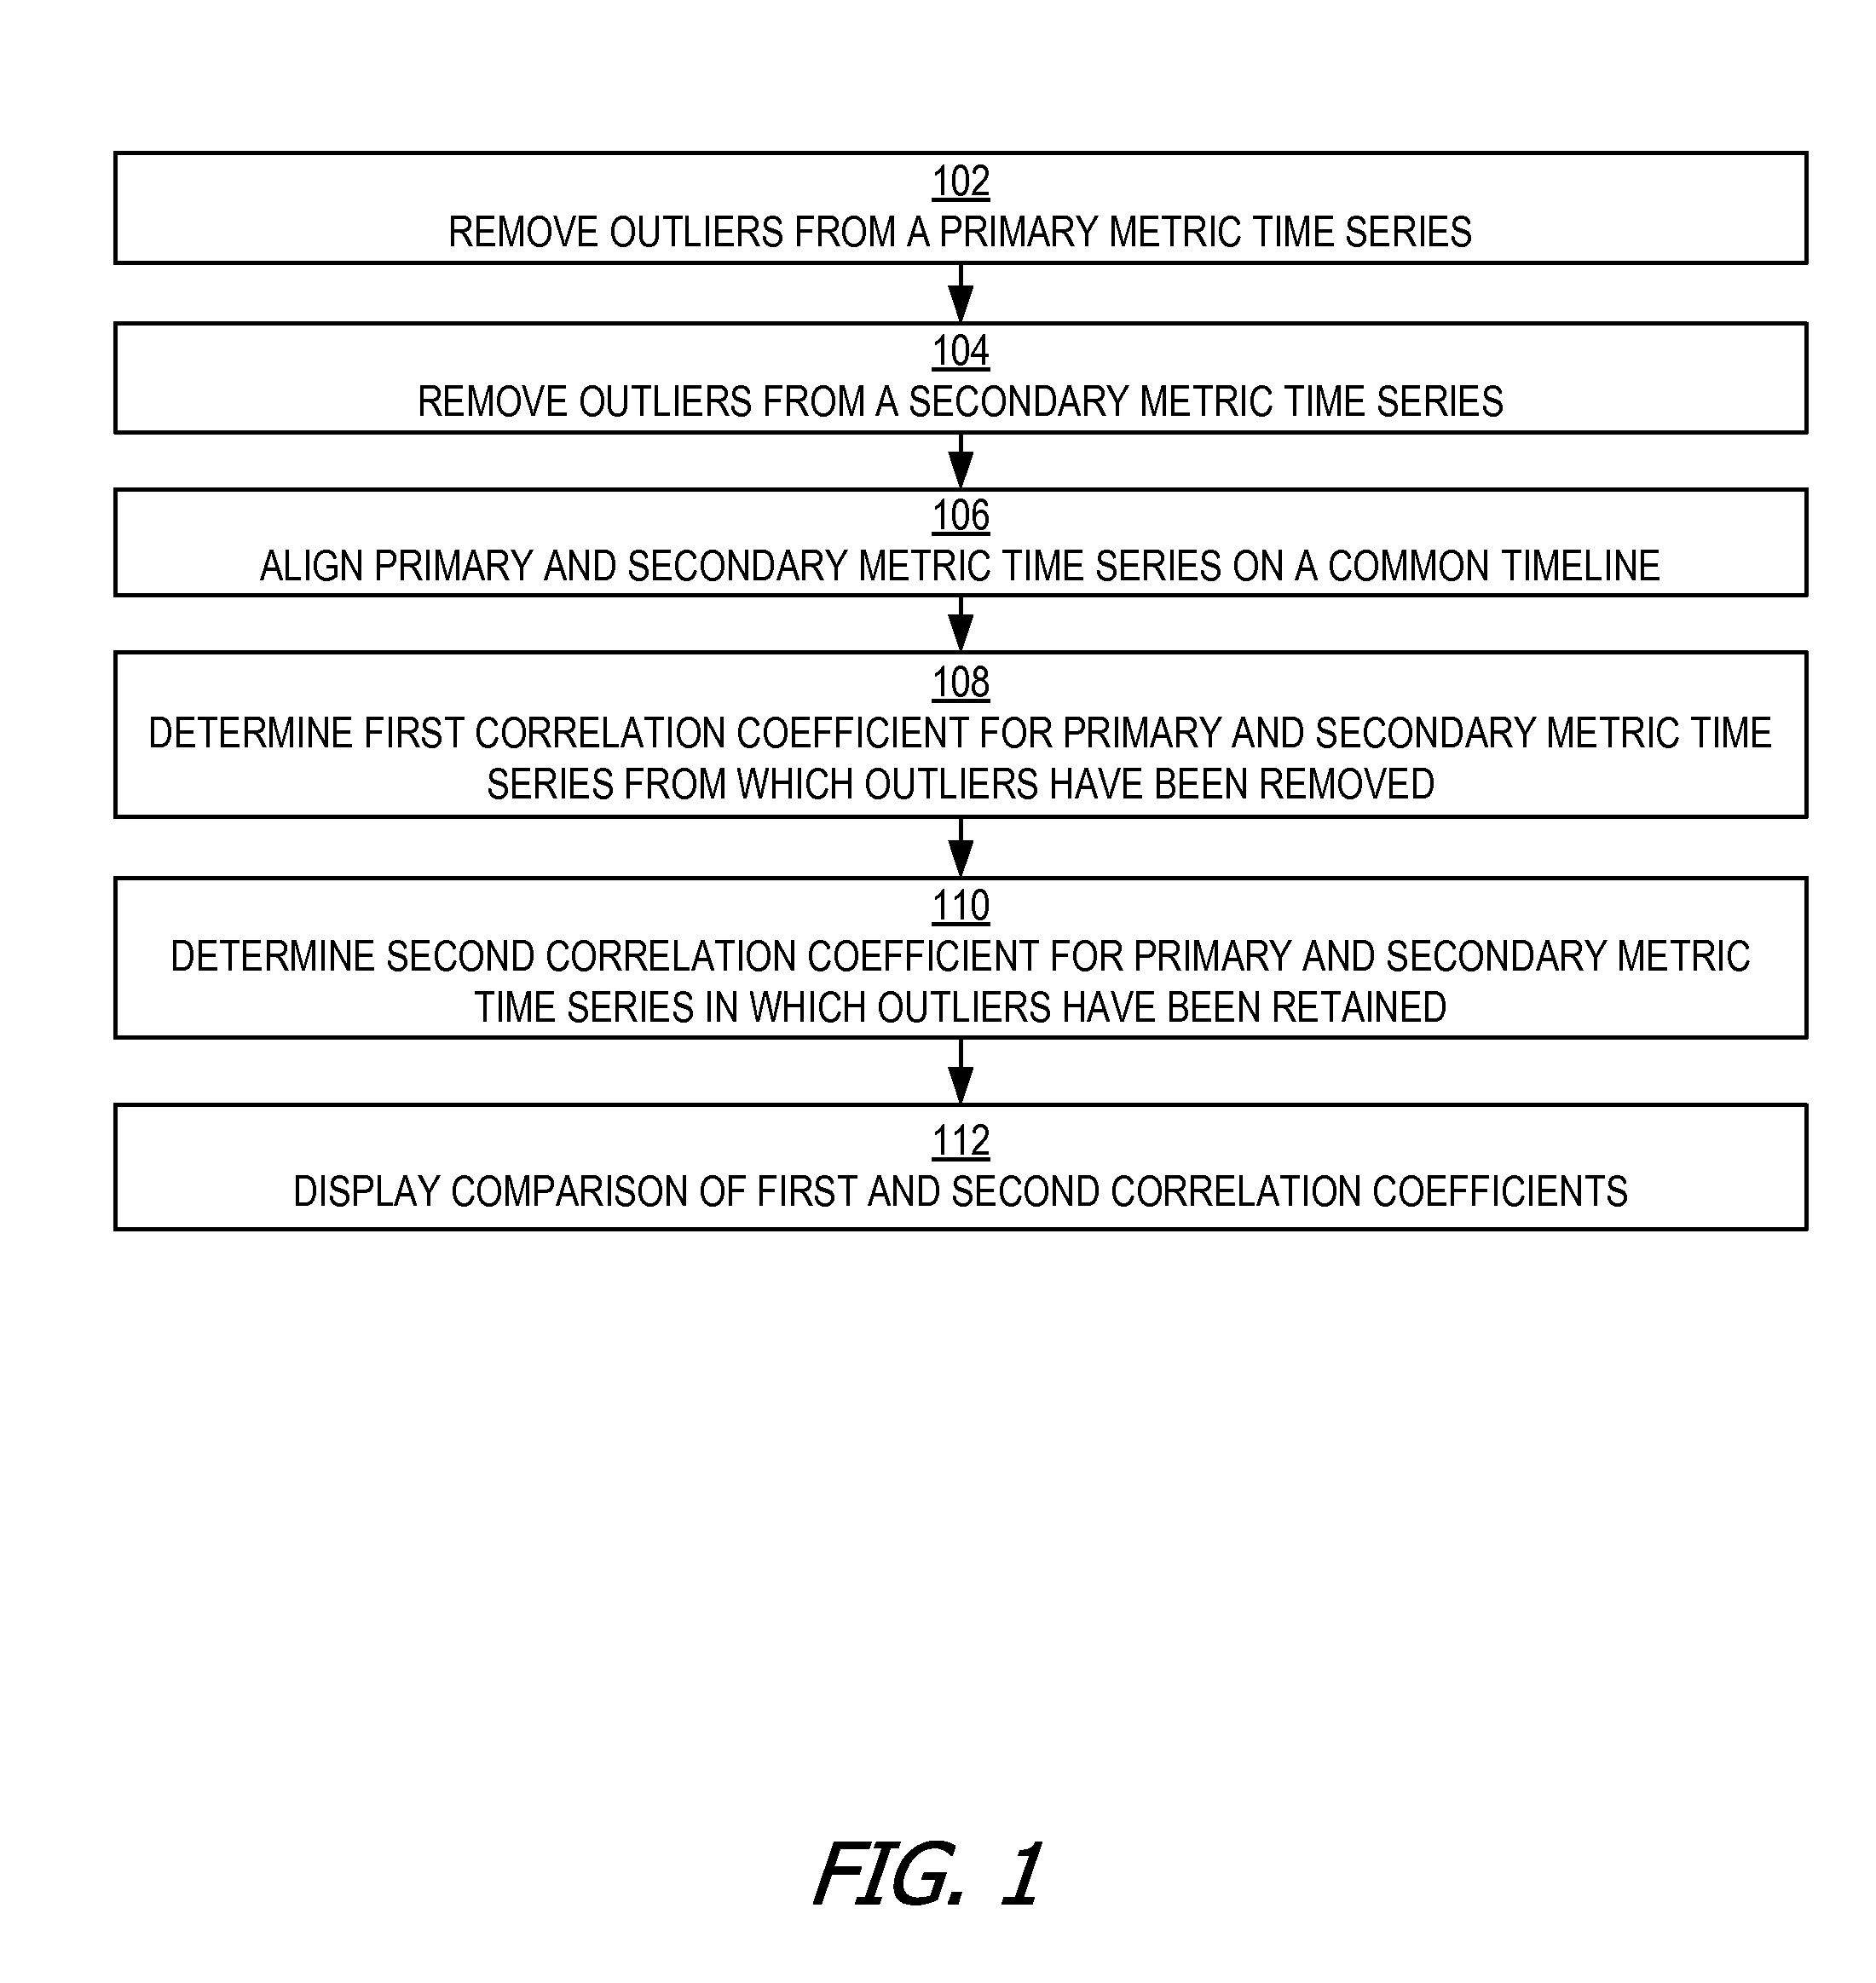
The patent text describes a method to determine the correlation between two sets of data that have been removed from outliers. Outliers are defined as the highest or lowest values in a data set. By removing the impact of outliers, the method improves the accuracy of the correlation analysis and provides a better representation of the relationship between the data sets.

Problems solved by technology

Automated monitoring systems monitor information technology infrastructure along with complex software deployments, such as deployments within a cloud computing environment.
During normal operations of large deployments, error conditions can occur.
These error conditions can affect the metrics.
However, during times that the database is unavailable, perhaps due to the database system experiencing some error, this response time could decrease to just 20 milliseconds, as the web page relatively quickly returns an error instead of data queried from the database.
Outliers can occur within a metric time series due to errors or other problems influencing hardware systems and / or the software systems that execute upon those hardware systems.
Error conditions could occur for a variety of reasons, including, for example, software bugs, malformed user input, network glitches, and other intermittent issues.
However, if one or both metric time series contain outlying values that represent abnormal behavior, such as error conditions, then the correlation coefficient produced by these algorithms could be significantly impacted by these outliers.
As a result, analysts studying correlations between different subsystems in a cloud deployment may incorrectly conclude that one subsystem does not influence another subsystem.

Method used


Image

  • Metric time series correlation by outlier removal based on maximum concentration interval
  • Metric time series correlation by outlier removal based on maximum concentration interval
  • Metric time series correlation by outlier removal based on maximum concentration interval

Examples


example point

Intervals

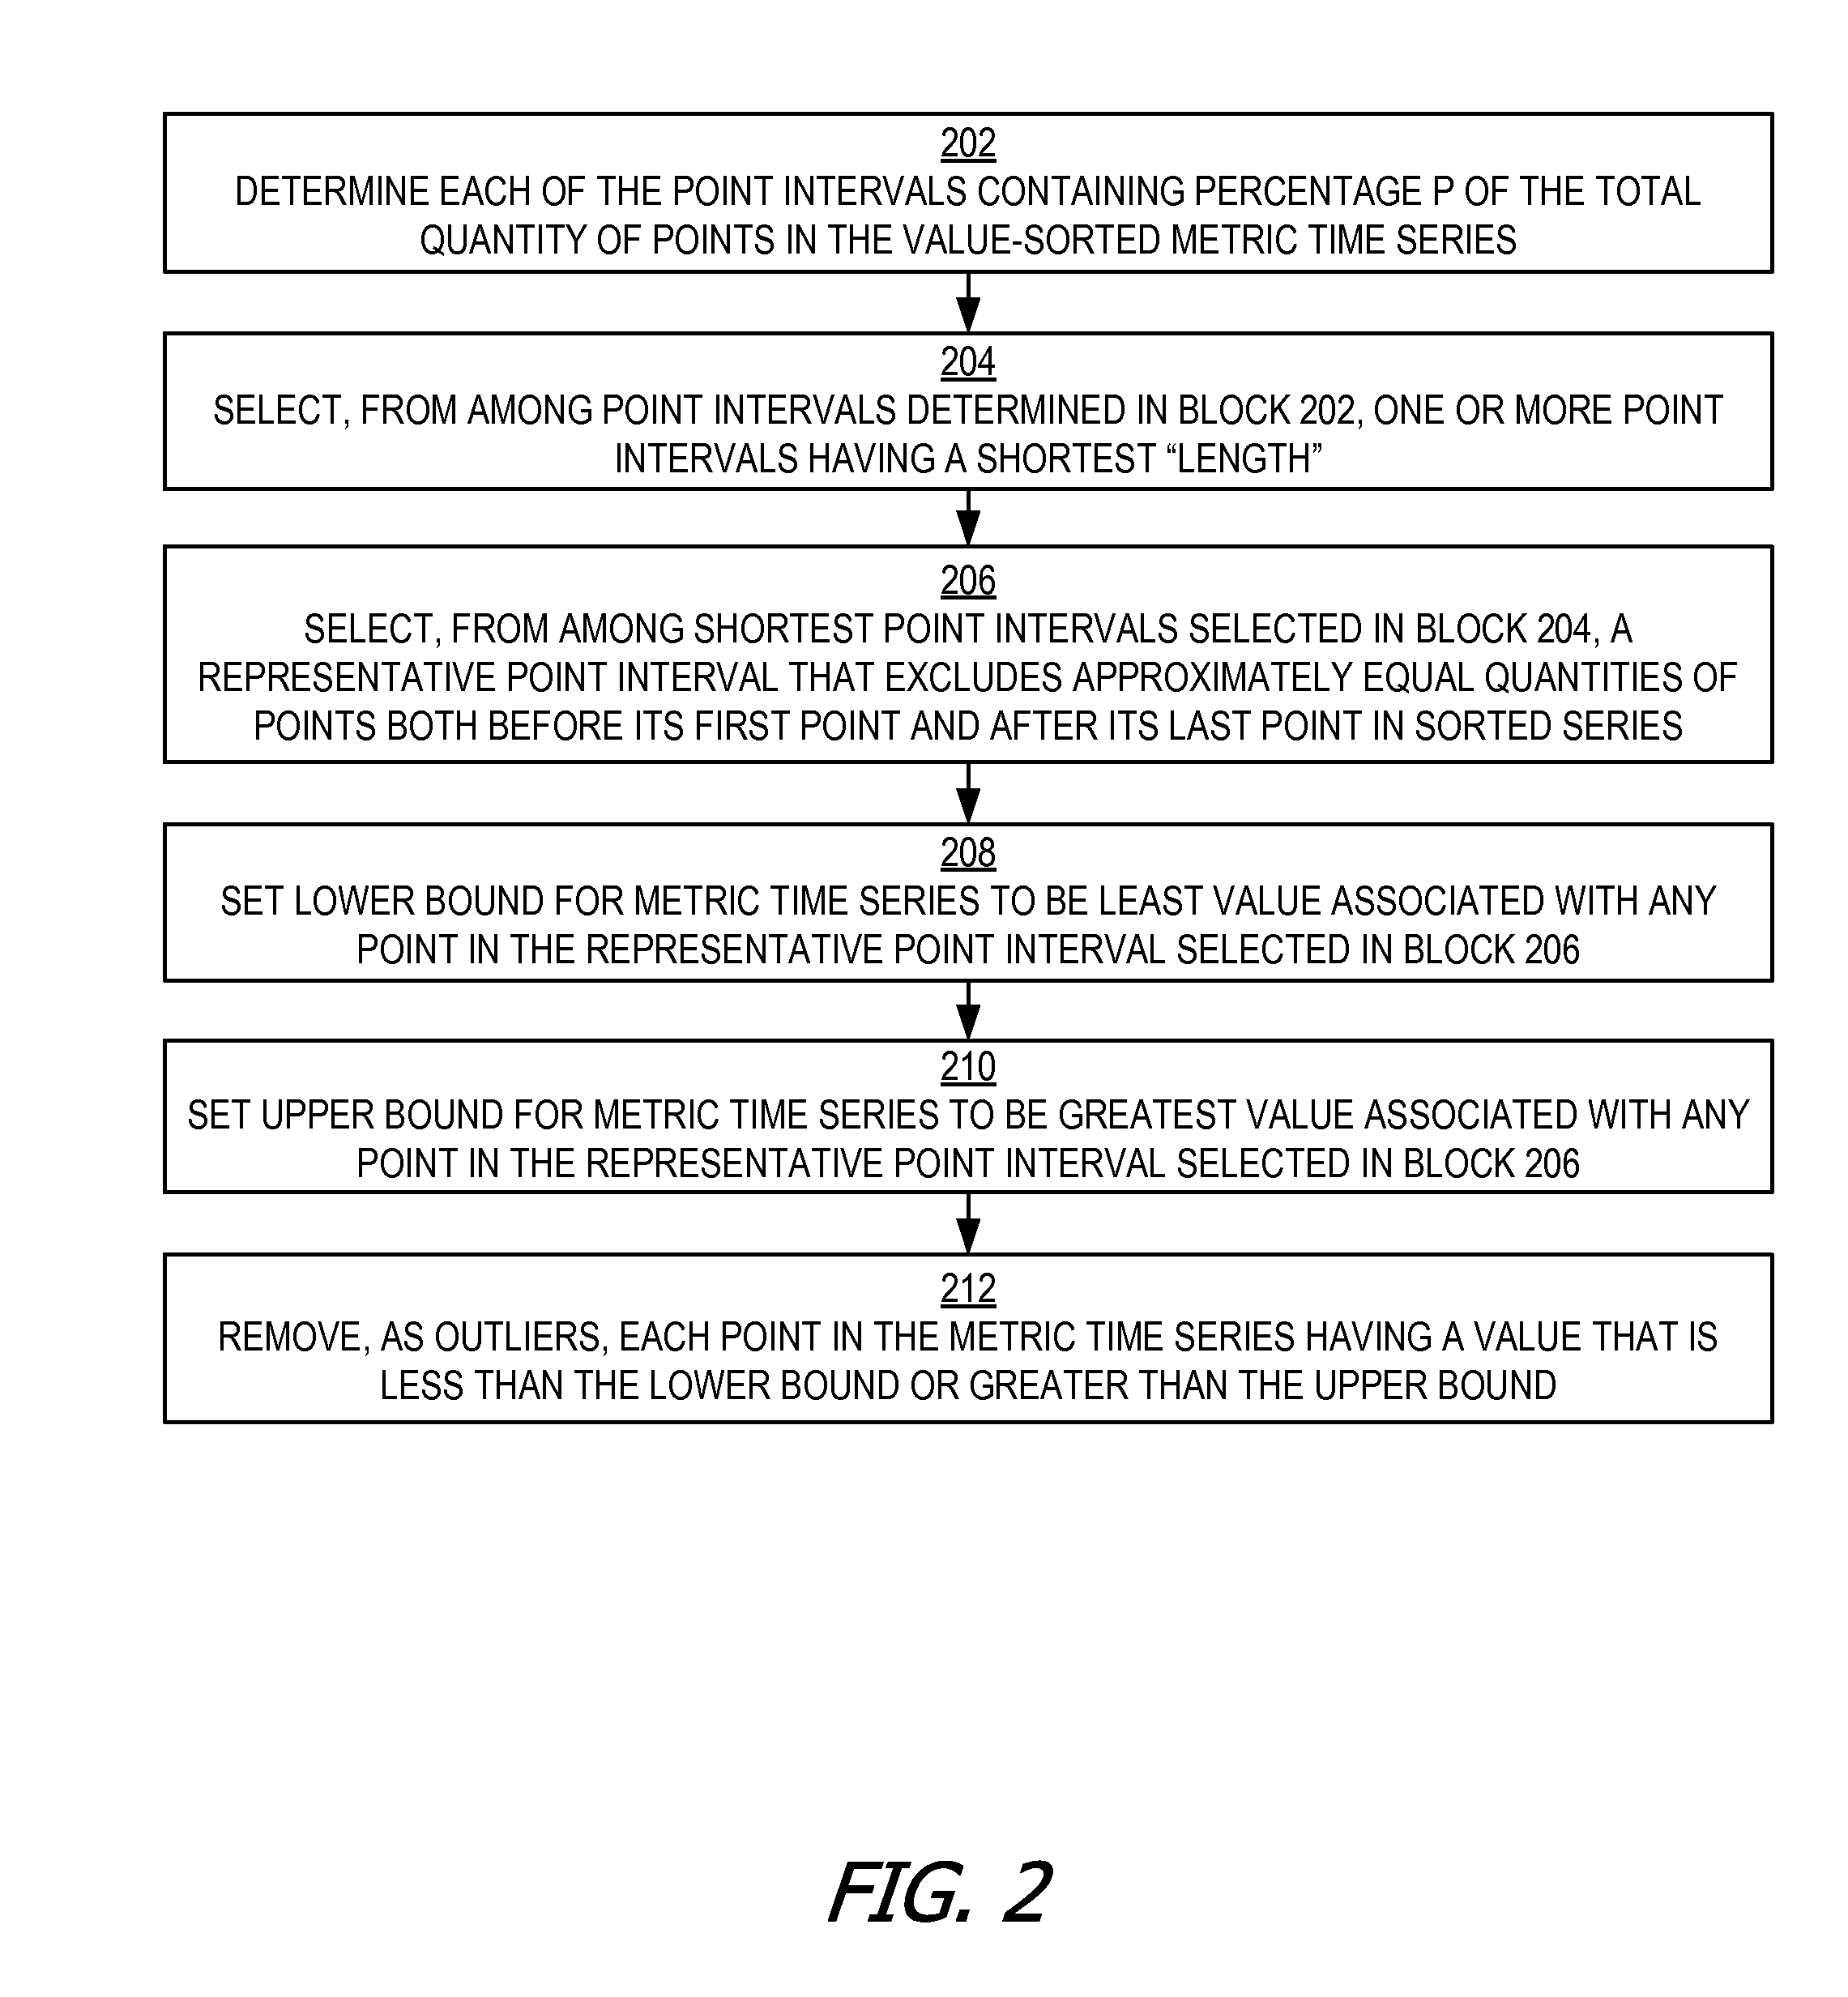
[0054]As is discussed above, in some embodiments, the points in a metric time series are sorted by their associated values (rather than their associated timestamps), after which multiple point intervals containing at least a specified percentage p of the points in the metric time series are determined.

[0055]FIG. 3 is a diagram that illustrates an example of multiple point intervals occuring within a metric time series in which points have been sorted by their associated values, according to some embodiments. For reasons of simplicity, the timestamps associated with the points are not shown.

[0056]In FIG. 3, value-sorted metric time series 300 includes 20 points 302A-302T. Assuming that percentage p is 90%, each point interval determined from value-sorted metric time series 300 contains 18 of the 20 points. A point interval 304A includes points 302A-302R. A point interval 304B includes points 302B-302S. A point interval 304C includes points 302C-302T.

[0057]The least and great...

example timeline alignment

[0062]As is discussed above, in some embodiments, after outliers have been removed from each of a pair of metric time series, those metric time series are aligned along a timeline, and points from either metric time series that do not have a corresponding point from the other metric time series in the same time unit are removed from that metric time series.

[0063]FIG. 4 is a diagram that illustrates an example of aligning a pair of metric time series along a timeline, according to some embodiments. A metric time series 402A is aligned along a timeline 400 with a metric time series 402B. Timeline 400 is segmented into time units 404A-J. The points in metric time series 402A and 402B are sorted, as usual, in order of their associated timestamps.

[0064]Metric time series 402A includes points 406A-H. Metric time series 402B includes points 408A-H. However, not all of points 406A-H are aligned with points 408A-H within time units 404A-J. In time unit 404C, metric time series 402A contains ...


PUM


Abstract

A correlation relationship between two metric time series is determined after removing the impact of outlying metric values (“outliers”) that are unimportant for analytical purposes. Each of the metric time series can represent values of different system metrics obtained by mining data gathered through the monitoring of cloud deployments. The outliers can be determined based on a maximum concentration interval of the data. Removing the impact of the outliers enhances the correlation of the metric time series and provides a better representation of the correlation relationship.

Description

CROSS-REFERENCE TO RELATED APPLICATIONS[0001]The present application claims benefit under 35 USC 119(e) of U.S. Provisional Application No. 62 / 056,325, filed on Sep. 26, 2014 by Poola et. al. and entitled “Metric Time Series Correlation by Outlier Removal Based On Maximum Concentration Interval,” of which the entire disclosure is incorporated herein by reference for all purposes.BACKGROUND[0002]Automated monitoring systems monitor information technology infrastructure along with complex software deployments, such as deployments within a cloud computing environment. The monitoring systems monitor the infrastructure and the deployments using metrics that represent the load, state, health, and behavior of each component in the infrastructure and each component of the software deployed in that infrastructure.[0003]During normal operations of large deployments, error conditions can occur. These error conditions can affect the metrics. When information technology operations staff detect e...

Claims


Application Information

Patent Timeline
Patent Type & Authority Applications(United States)
IPC IPC(8): G06F17/30
CPCG06F17/30377G06F17/30539G06F16/2379
Inventor POOLA, THYAGARAJUVOLCHEGURSKY, VLADIMIR
Owner ORACLE INT CORP
Learn More