Method for monitoring focus in EUV lithography
- Summary
- Abstract
- Description
- Claims
- Application Information
AI Technical Summary
Benefits of technology
Problems solved by technology
Method used
Image
Examples
example 1
[0038]Referring to FIG. 5, the plot shows the experimentally measured width of trenches through focus, for seven different exposure doses. The left plot shows values for vertical trenches, the right plot shows values for horizontal trenches. The dose multiplier relative to the center dose is shown in the legend for each of the curves. A dose multiplier of 1.03, for example, indicates a dose that is 3 percent higher than the center dose. A higher dose leads to a larger width for the printed trench. The pitch of the structures that are measured on this wafer is 72 nm, while the measured width of the trenches is between about 15 and 25 nm. The pitch of the openings on the mask is four times the pitch on the wafer, or 288 nm in this case. There are no assist features between the main features. This is the reason for the strong variations in width through focus for the Bossung curves shown here. The mask is illuminated with quadrupole illumination that is described in the previous paragr...
example 2
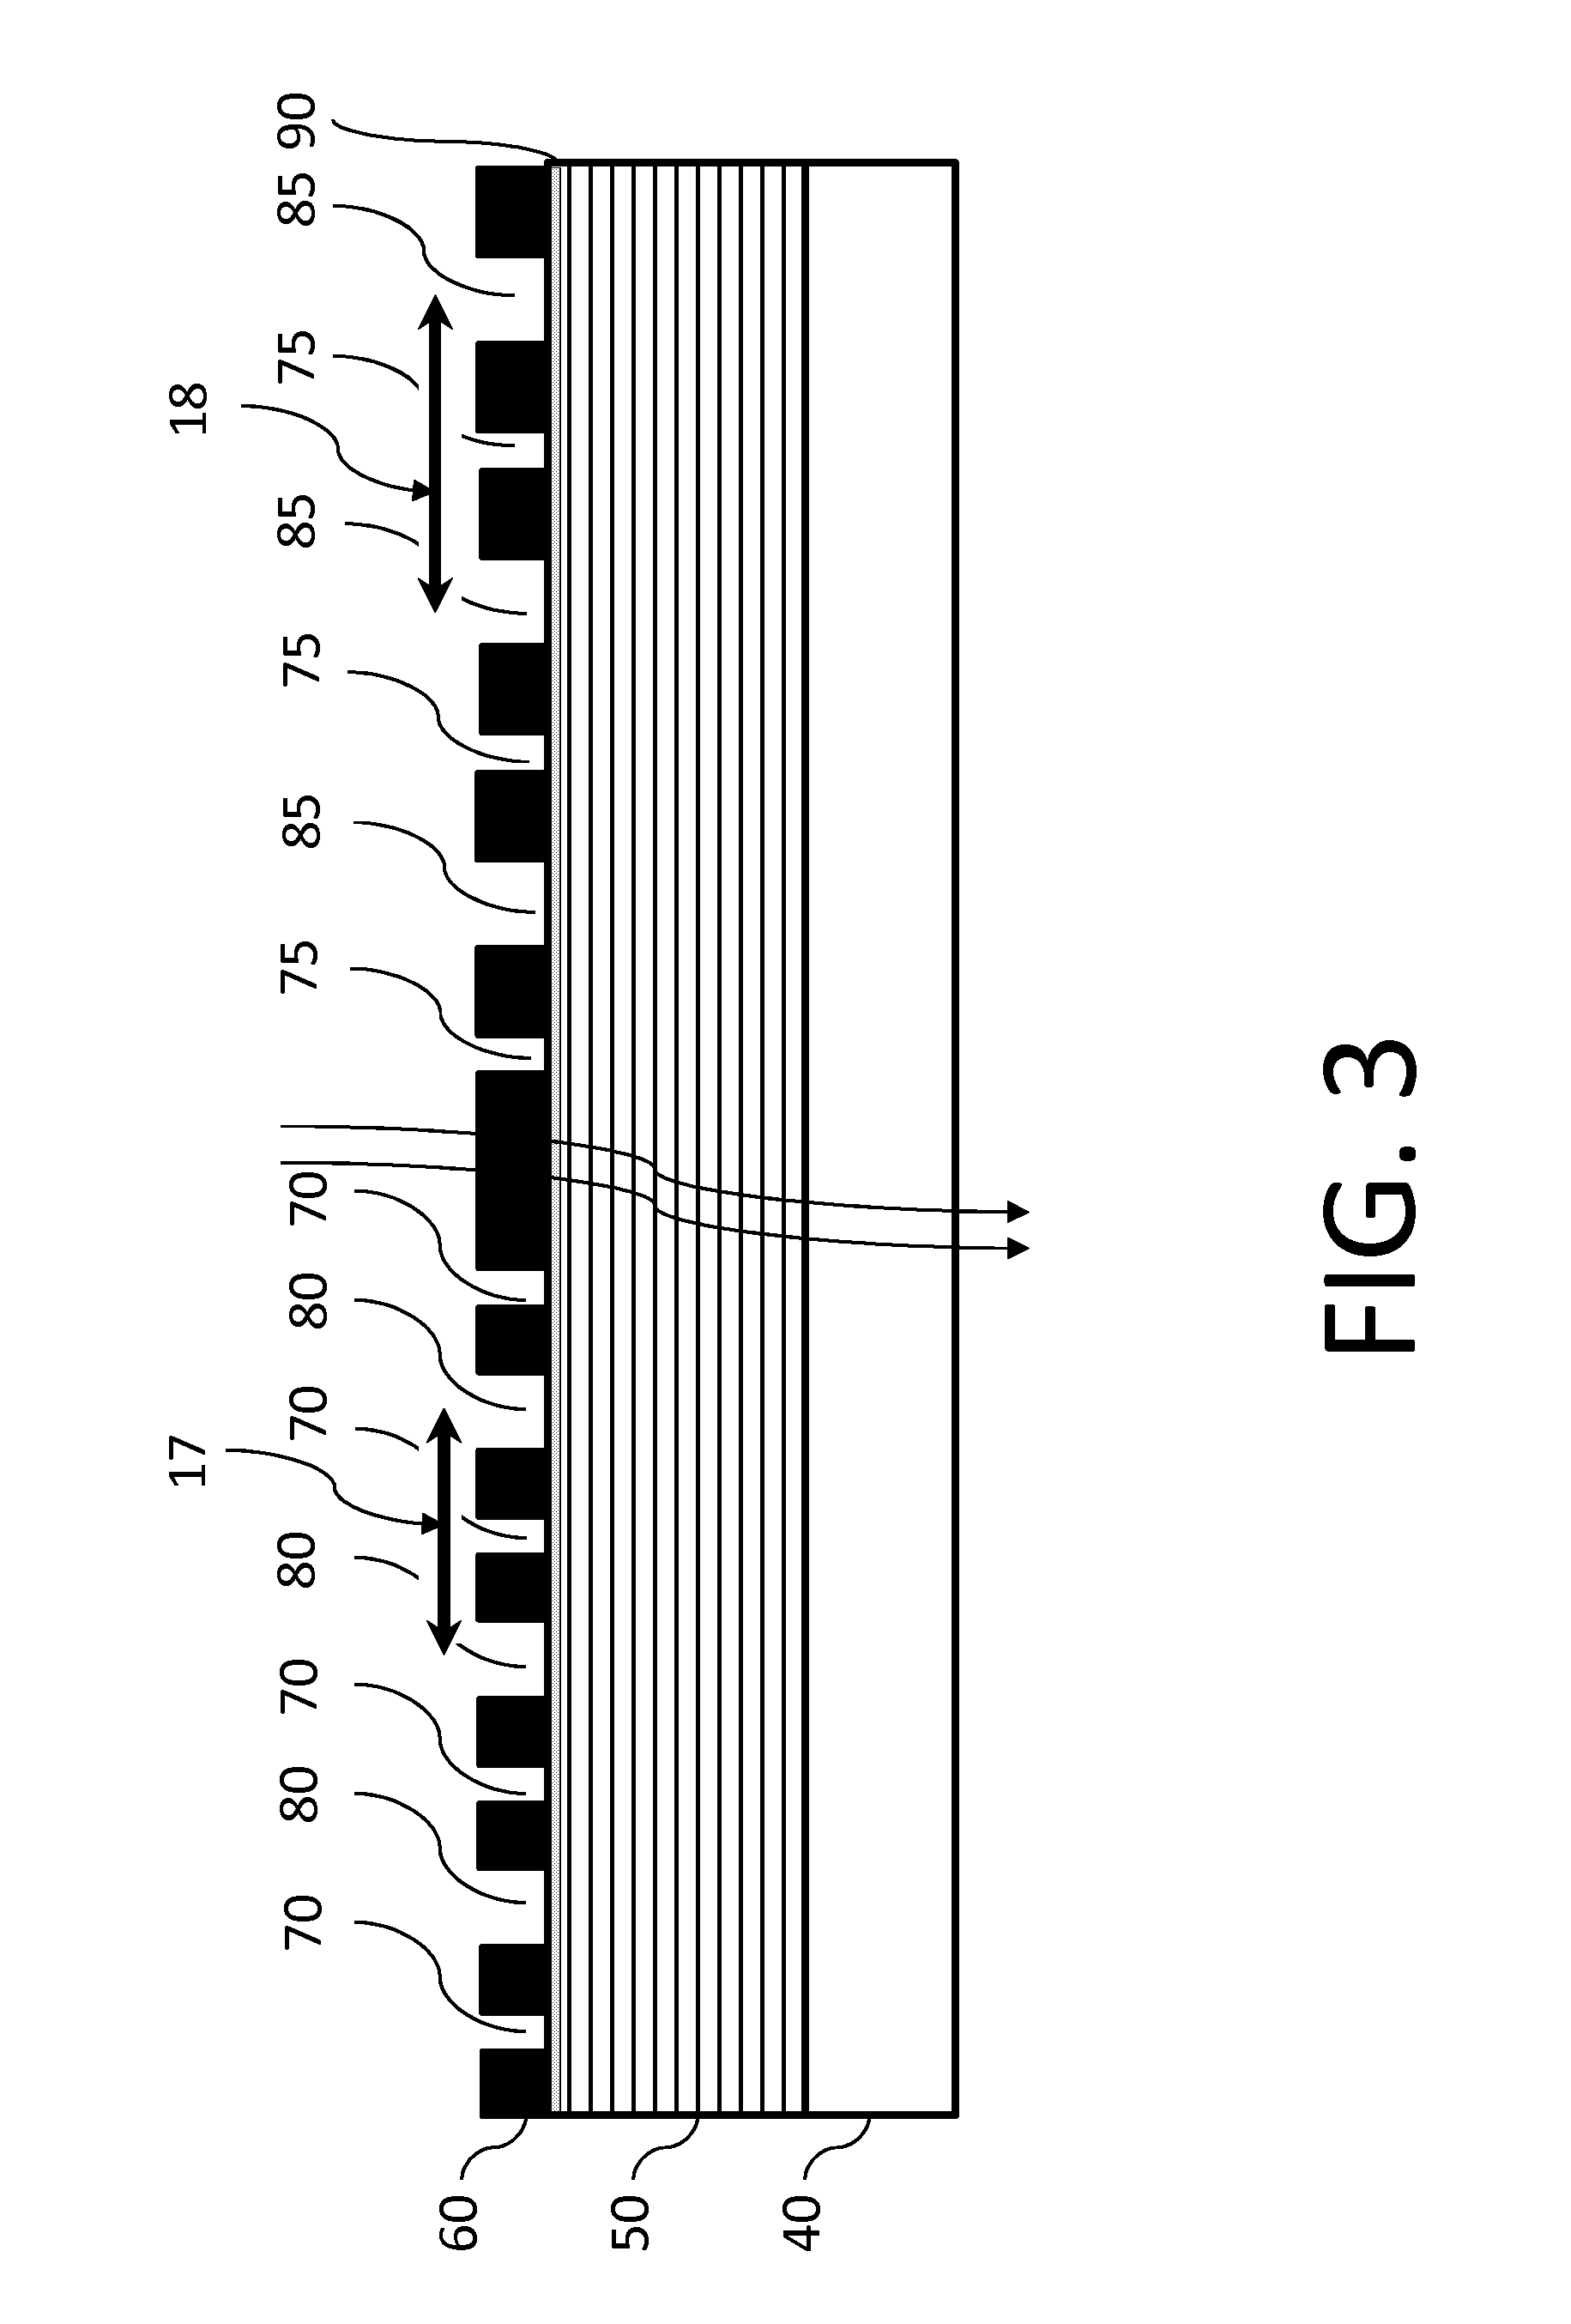
[0039]Referring to FIG. 6, the plot shows experimentally measured width of trenches through focus for printed trenches of the same pitches and exposure conditions as shown in FIG. 5, with the only difference being the addition of assist features between the main features on the mask. The best focus, defined as the focus for which the slope of the linewidth vs focus curve is horizontal, is moved to much more positive values for the assist feature case shown in FIG. 6 compared to the best focus in FIG. 5.
example 3
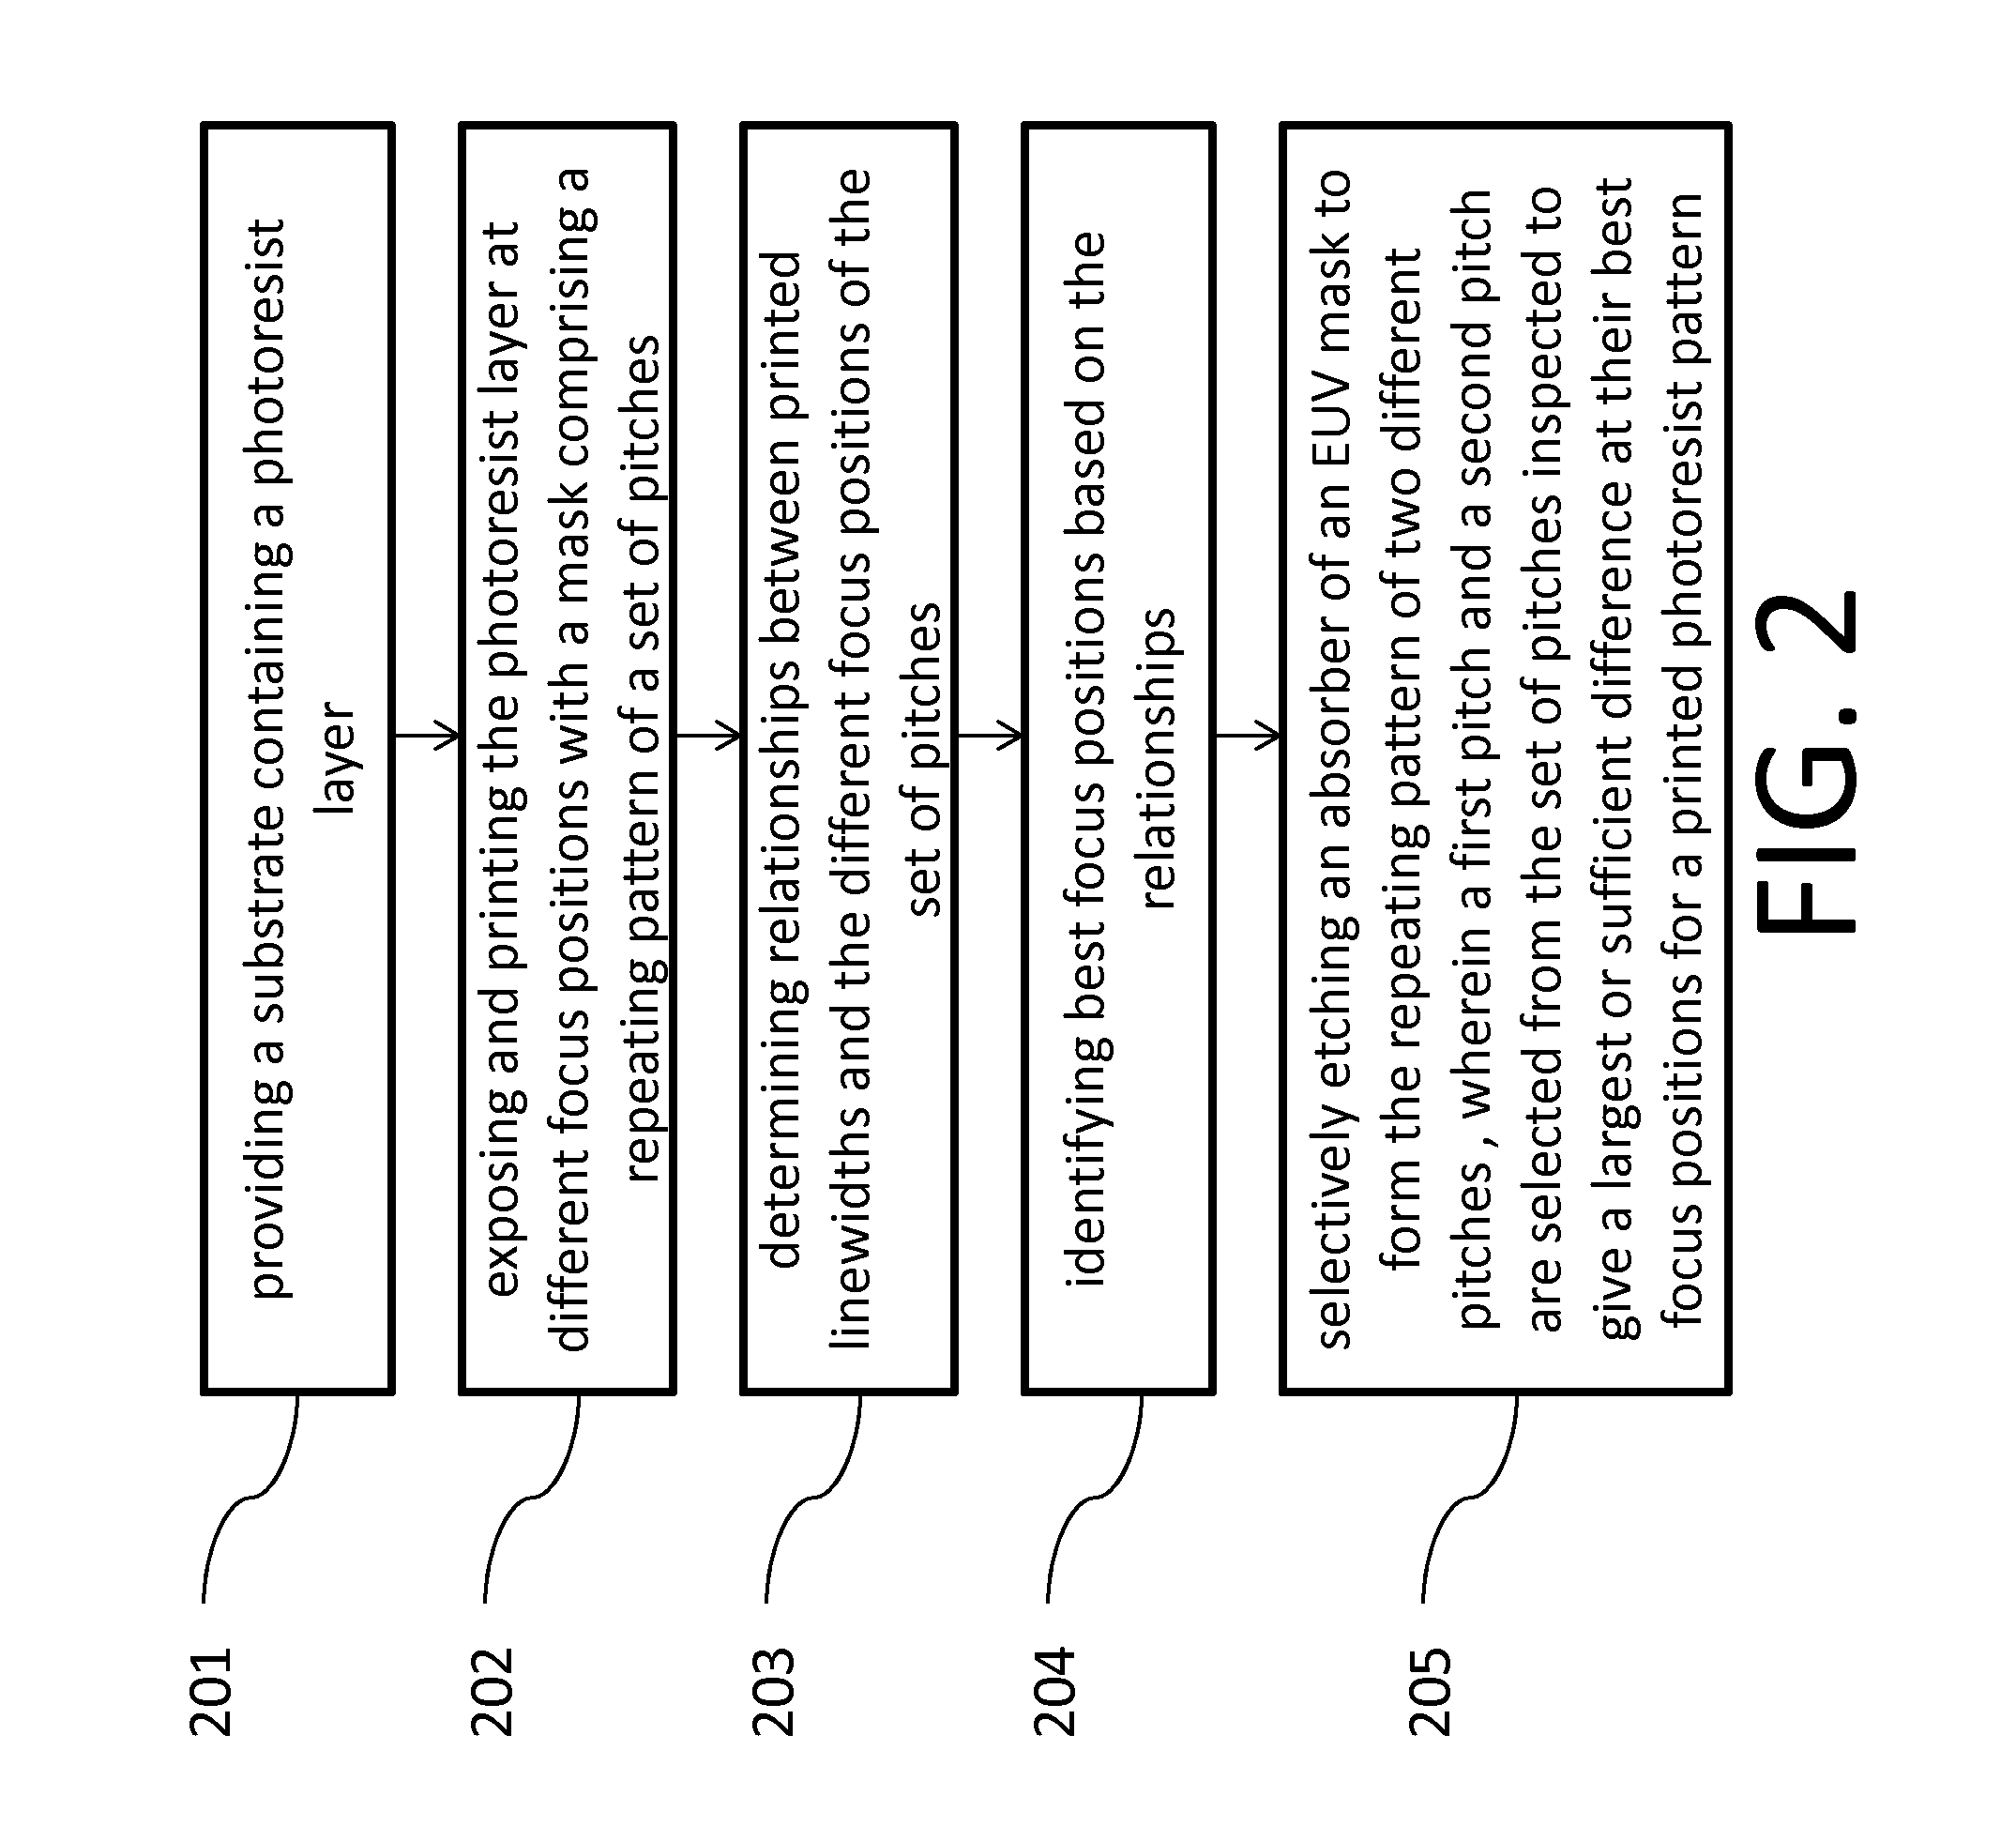
[0040]Referring to FIG. 7, the plot shows the simulated focus response of the trench width for only the best dose. Shown is the focus response for a 72 nm pitch grating with 10 nm assist features, and a 112 nm pitch grating with 10 nm assist features, as well as the difference between the linewidth at the two pitches, with the scale to the right. When the difference between the two linewidths is taken, it shows a monotonically increasing signal with focus which can be calibrated for a process according to the flow chart in FIG. 4. This monotonic function of linewidth difference vs. focus then serves as a definite metric so that the focus can be determined for any exposed wafer by just measuring two linewidths for the two different pitches and taking the difference. For the simulation results shown in FIG. 7, a commercial software tool is used that is able to calculate the exact diffraction orders that are reflected off the mask. Such simulations can be used to select the best pitche...
PUM
 Abstract
Description
Claims
Application Information
 - R&D
- Intellectual Property
- Life Sciences
- Materials
- Tech Scout
- Unparalleled Data Quality
- Higher Quality Content
- 60% Fewer Hallucinations
Browse by: Latest US Patents, China's latest patents, Technical Efficacy Thesaurus, Application Domain, Technology Topic, Popular Technical Reports.
© 2025 PatSnap. All rights reserved.Legal|Privacy policy|Modern Slavery Act Transparency Statement|Sitemap|About US| Contact US: help@patsnap.com


