
Well-bore and reservoir monitoring process by logging temperature and resistivity

a technology of resistivity and temperature, applied in the field of wellbore monitoring process, can solve the problems of high cost, failure to inhibit strategy, and high injectivity and productivity of hammer formation

Inactive Publication Date: 2017-03-16
KING FAHD UNIVERSITY OF PETROLEUM AND MINERALS +1
View PDF1 Cites 11 Cited by
  • Summary
  • Abstract
  • Description
  • Claims
  • Application Information

AI Technical Summary

Benefits of technology

The patent text describes a process for monitoring a well-bore in a carbonate formation and inhibiting the formation of scale. The process involves logging the temperature and resistivity of the soil, rock, and brine mixture present in the carbonate formation continuously, and interpreting these logs to identify dissolution of rock and precipitation of scale by concurrent events in the temperature and resistivity. An antiscalant can then be injected into the well-bore based on the interpretation of the logs. The technical effect of this process is to provide a more effective means for monitoring and inhibiting scale formation in well-bore carbonate formations.

Problems solved by technology

A common production or injection problem in CO2 sequestration projects is scale formation in reservoirs and around injection and production wells, which hampers formation injectivity and productivity.
Sources of concern with these methods include high cost, possible unsuccessful inhibition strategy, and susceptibility of surface analysis to errors.
Other problems include compositional change with time of produced fluid caused by evolution of dissolved gases (e.g. CO2), scale precipitation, co-precipitation of scaling ions with suspended solids, and microbial actions.
Hence, computer modeling does not effectively capture the dynamics of produced water chemistry.
The cost of intervention and the cost of production loss during periodic reservoir measurements can be extremely high.
These studies did not consider what happens with formation resistivity after a longer experimental period.

Method used


Image

  • Well-bore and reservoir monitoring process by logging temperature and resistivity
  • Well-bore and reservoir monitoring process by logging temperature and resistivity
  • Well-bore and reservoir monitoring process by logging temperature and resistivity

Examples


example 1

Experimental Setup

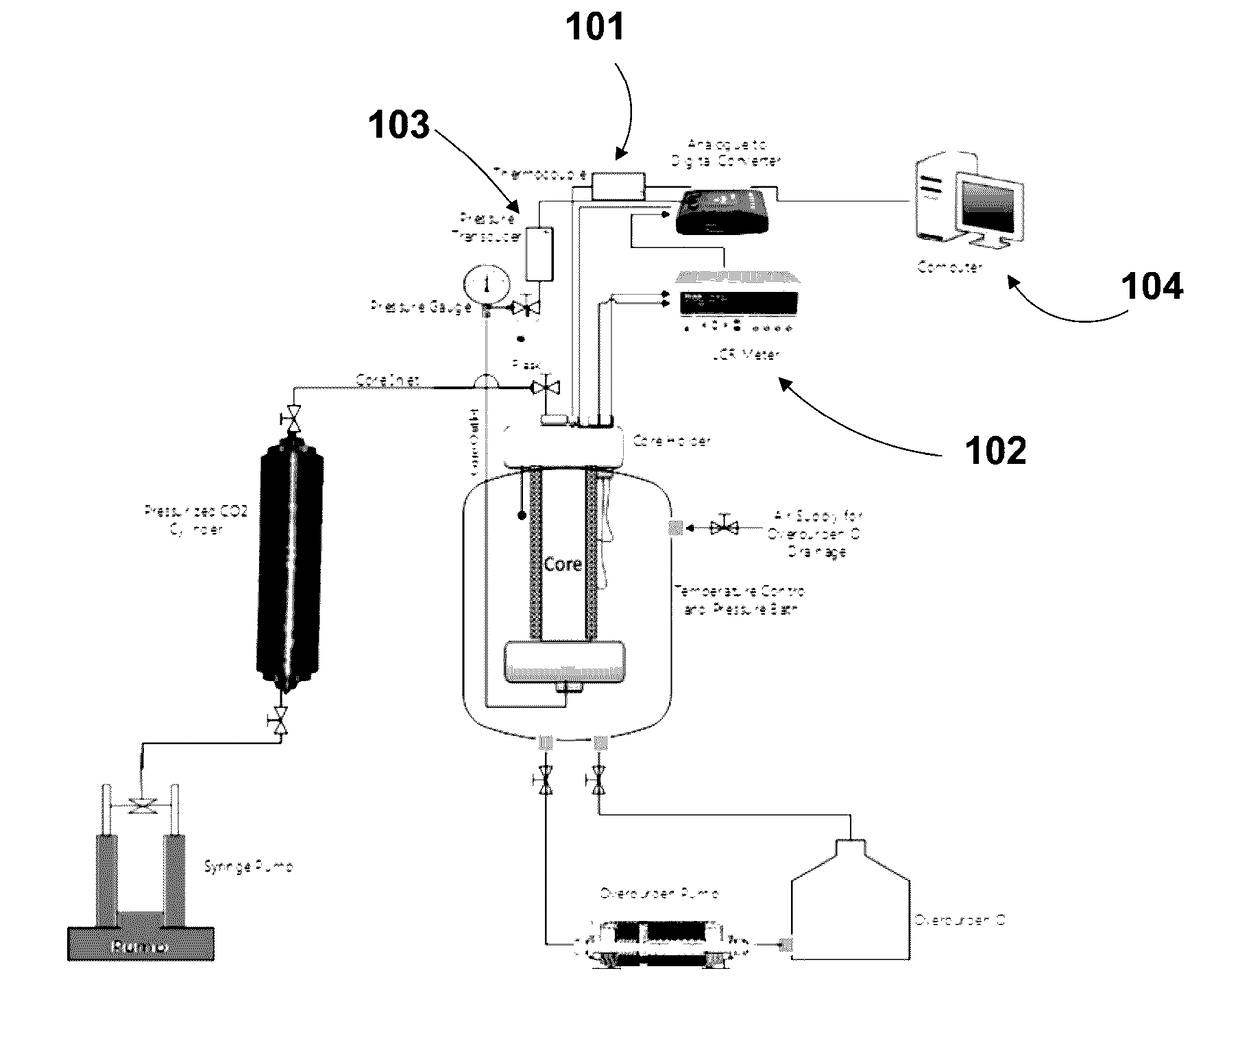
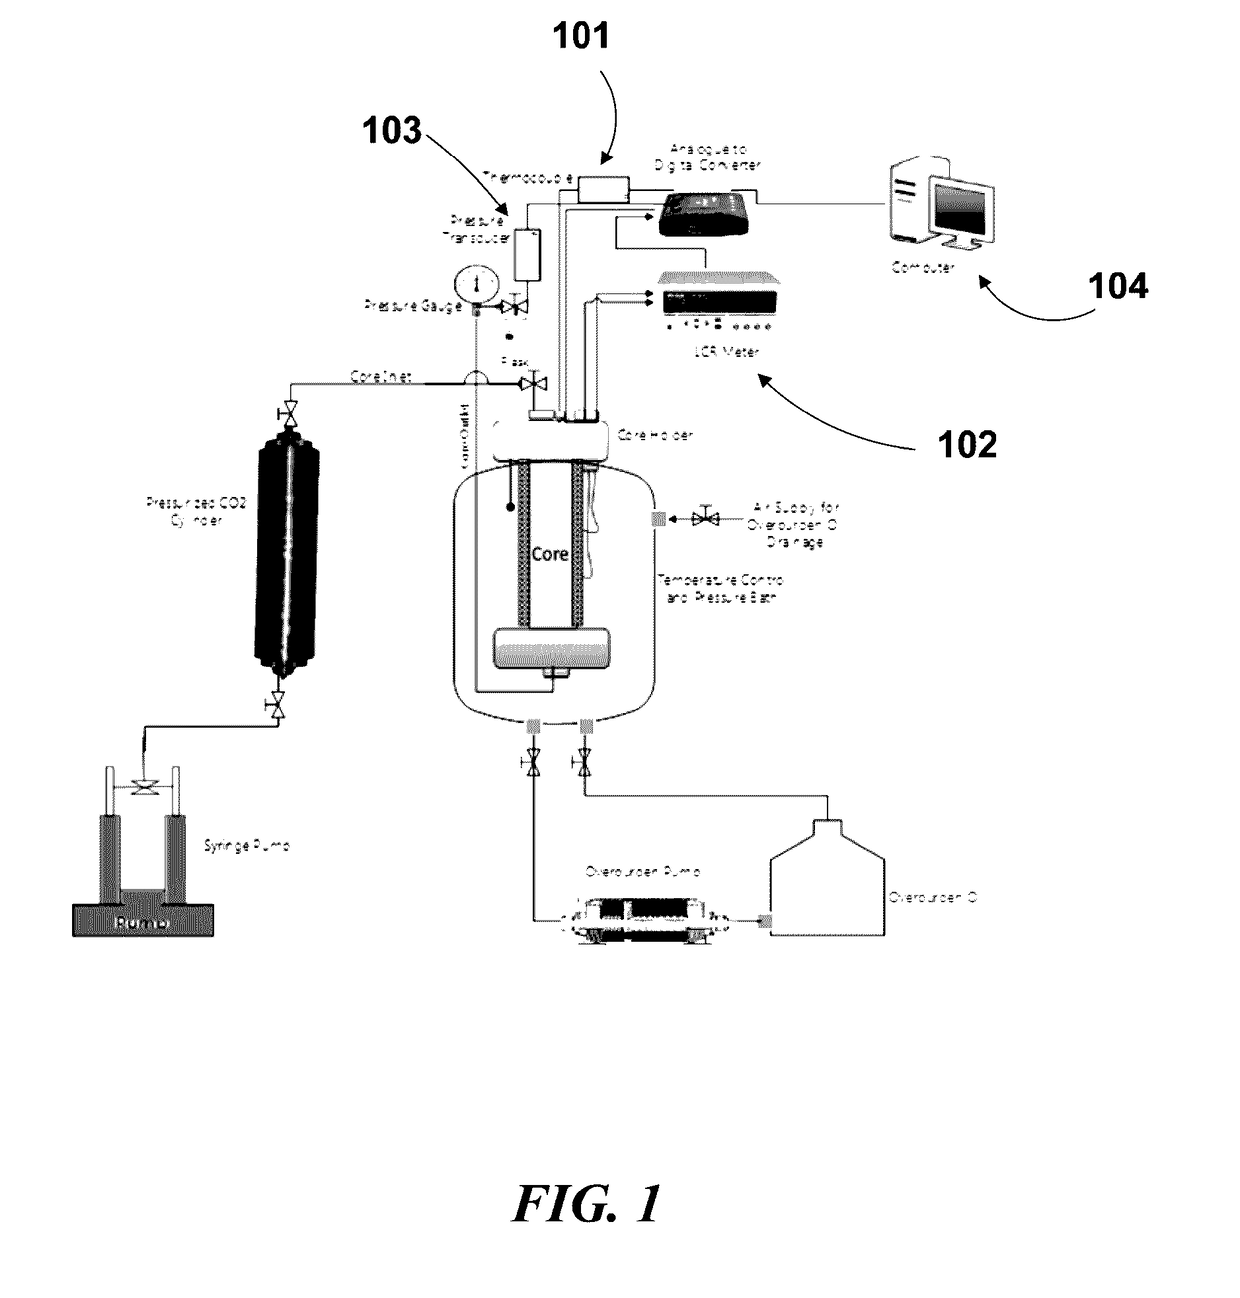
[0075]Carbonate rock samples were collected from the same rock quarry of Indiana limestone with recorded high level of homogeneity, which is important so as to be able to compare results between samples. Furthermore, Mercury injection capillary pressure (MICP) and NMR analysis in addition to porosity measurements were used to ascertain homogeneity.

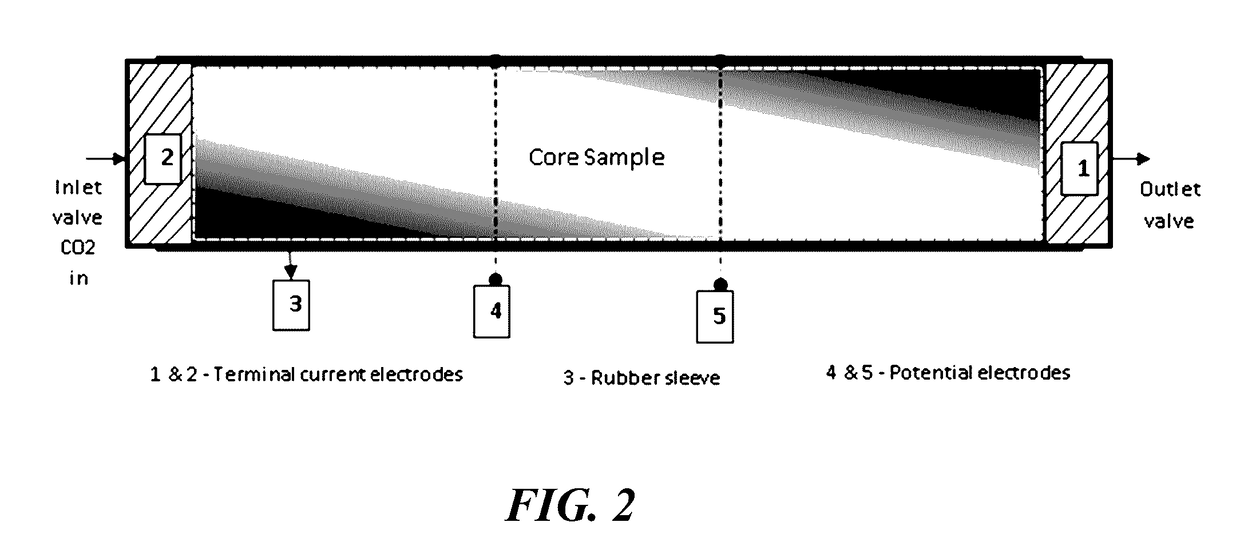
[0076]Samples were cut into cylindrical cores and their ends surface grinded to achieve very flat faces necessary for good electrical contact. They were then cleaned with methanol in a soxhlet apparatus to remove all salt deposits from their pores. They were then dried in a vacuum oven after which sample dimensions and properties were measured (Table 1). Synthetic brine with composition and properties in Table 2 was prepared and used to saturate core samples.

TABLE 1Core propertiesBulkHeAirSampleLDVol.PorositypermeabilityID(cm)(cm)(cc)(%)KIL-17.0643.73677.4317.790423IL-27.0343.74177.3718.367324IL-36.8153.73774.7619.458536I...

example 2

Results and Discussion

[0078]Combined logs of resistivity and temperature with time for all samples are shown in FIG. 3-7. It was observed that the resistivity and temperature logs remain fairly constant after CO2 injection until after about 150 hours, when the log deflected to the left. The log prior to deflection was then taken as the baseline log for all the CO2 storage experiments. FIGS. 3A and 3B and FIGS. 4A and 4B show the combined resistivity and temperature logs for CO2 storage in sample IL-1 and IL-2 respectively. The two logs (resistivity and temperature) showed similar trends in both samples tested. Electrical resistivity signature was constant prior to CO2 injection and later increased in response to CO2 influx and remained constant again around this resistivity value until after quite a number of days (4-6 days in both experiments) when the constant resistivity pattern deflected from the baseline to the left suggesting the onset of chemical reactions between the three p...

example 3

Significance and Field Applicability

[0091]1. Long term monitoring of geochemical processes during CO2 sequestration in saline aquifers: The disclosure is applicable for monitoring CO2 saturation distribution as well as mineralization of the injected CO2 in deep saline aquifer of carbonate formation type. The geological formation must also be of closed boundary such that water saturation remains constant during and after injection. This is to ensure that resistivity change is not due to change in water saturation from external source but only due to geochemical processes (rock dissolution and precipitation) as observed in the experimental results. CO2 storage by mineralization (also called scaling or precipitation) is the safest and the long term goal of all sequestration projects. Observation wells drilled (or existing wells converted to observation wells) across a geological formation such as a deep saline aquifer for the purpose of sequestering and monitoring CO2 should be equippe...


PUM


Abstract

A well-bore monitoring process involving logging the temperature of a soil, rock, and brine mixture present in a carbonate formation continuously, and simultaneously logging the resistivity of the soil, rock, and brine mixture in the carbonate formation continuously. The logged temperature and the logged resistivity are interpreted whereby concurrent events in the logged temperature and the logged resistivity identify dissolution of rock into the mixture and precipitation of scale from the mixture. The simultaneous logging of the temperature and the resistivity is conducted in a well-bore in the carbonate rock formation.

Description

STATEMENT OF ACKNOWLEDGEMENT[0001]This project was funded by King Fand University of Petroleum & Minerals and King Abdul-Aziz City of Science and Technology under project number KACST-TIC-CCS-6.BACKGROUND OF THE INVENTION[0002]Technical Field[0003]The present invention relates to a well-bore monitoring process involving logging the temperature and resistivity of a soil, rock, and brine mixture in a carbonate rock formation continuously to identify the formation of scale.[0004]Description of the Related Art[0005]The “background” description provided herein is for the purpose of generally presenting the context of the disclosure. Work of the presently named inventors, to the extent it is described in this background section, as well as aspects of the description which may not otherwise qualify as prior art at the time of filing, are neither expressly or impliedly admitted as prior art against the present invention.[0006]A common production or injection problem in CO2 sequestration pro...

Claims


Application Information

Patent Timeline
IPC IPC(8): E21B49/00E21B49/08G05B15/02E21B37/06C09K8/528E21B47/06E21B47/10
CPCE21B49/00E21B47/065E21B47/06E21B49/08E21B41/0064E21B37/06C09K8/528G05B15/02E21B2049/085E21B47/10E21B47/103E21B47/113E21B47/07Y02C20/40
Inventor ADEBAYO, ABDULRAUF RASHEEDAL-YOUSEF, HASAN YOUSEFMAHMOUD, MOHAMEDSULTAN, ABDULLAH SAAD
Owner KING FAHD UNIVERSITY OF PETROLEUM AND MINERALS
Learn More