Development of complex agricultural simulation models from limited datasets

a technology of simulation models and datasets, applied in the field of precision agriculture, can solve the problems of restricting the agricultural industry's ability to realize the full benefit of large-scale collection of data, and the inability to predict growth stages, so as to reduce the error rate of the model

Pending Publication Date: 2019-02-14
DTN LLC
View PDF4 Cites 17 Cited by
  • Summary
  • Abstract
  • Description
  • Claims
  • Application Information

AI Technical Summary

Benefits of technology

[0006]The aforementioned problems in the existing art of dealing with large-scale datasets can be addressed by applying a multi-step iterative modeling process that initially predicts an outcome for each situation in a particular dataset using current assumptions of a model, and then uses errors across these situations to identify where opportunities exist in the predictor space to make changes to the model's response to those predictor values that would reduce the model's error when averaged across all situations. While there are any number of ways in which the technique can be applied, it is most easily explained using the specific examples discussed further herein.

Problems solved by technology

A major obstacle to the successful application of ‘big data’ modeling to agricultural problems has been that data related to the agricultural processes to be simulated are often only recorded at a small number of times (and very often, just once) during any one specific case of the process, while that process actually occurs over potentially substantial periods of time, and often in response to changing plant physiological factors such as diseases, nutrient, and chemical applications, changing environmental factors such as soil, weather, and other environmental conditions, and changing ecosystem factors such as pests, canopy competition, and root competition.
This problem has restricted the agricultural industry's ability to realize the full benefit of some types of large-scale collections of data.
However, since there are any number of ways in which the crop could have evolved over time in order to arrive in the same given key growth stage on the same given date, those other growth stages cannot be predicted in this manner with the same level of accuracy as the one for which there are direct measurements to train the ANN with.

Method used


Image

  • Development of complex agricultural simulation models from limited datasets
  • Development of complex agricultural simulation models from limited datasets
  • Development of complex agricultural simulation models from limited datasets

Examples


example 1

/ PART B

[0066]A variant on Part A of the first example is to use the previously-discussed ‘absolute difference’ approach instead of the ‘relative difference’ approach applied above. In this approach (Part B), the absolute difference between the situation-specific accumulated growth metric value at maturity vs. the average accumulated growth metric value at maturity across all similar situations can be (e.g.) divided by the number of days between planting and maturity. The result is an adjustment 131 that could be added to the daily growth metric that was produced by the growth ANN 123 of the previous iteration, for all of the days between planting and maturity for that specific situation, in order to make the accumulated growth metric at maturity for that specific situation match that which is desired. Once a correction ANN 128 is trained on this adjustment data 131, it will produce an absolute adjustment that can be made to the growth ANN's output for the specific combination 126 of...

example 2

[0067]The technique applied in the first example can be expanded so as to automatically develop separate ANN models of interdependent problems from a common dataset 104. For example, if the observed end-of-season data elements of the first example are changed to be the harvest date and grain moisture on that date (instead of the maturity date), it is possible to add an additional outer iteration loop that coordinates back-and-forth iteration between the development of a growth ANN 410 to simulate the pre-maturity portion of the cropping cycle, and a ‘drydown’ ANN 420 to simulate the post-maturity drying of the crop's grain. FIG. 4 is a flow diagram illustrating this process 400 of automatically developing separate models of interdependent problems from a common dataset 104 according to the present invention.

[0068]In such a situation, a simple model for working backwards from the harvest date and grain moisture to estimate the date on which the associated crop reached maturity can be...

example 3

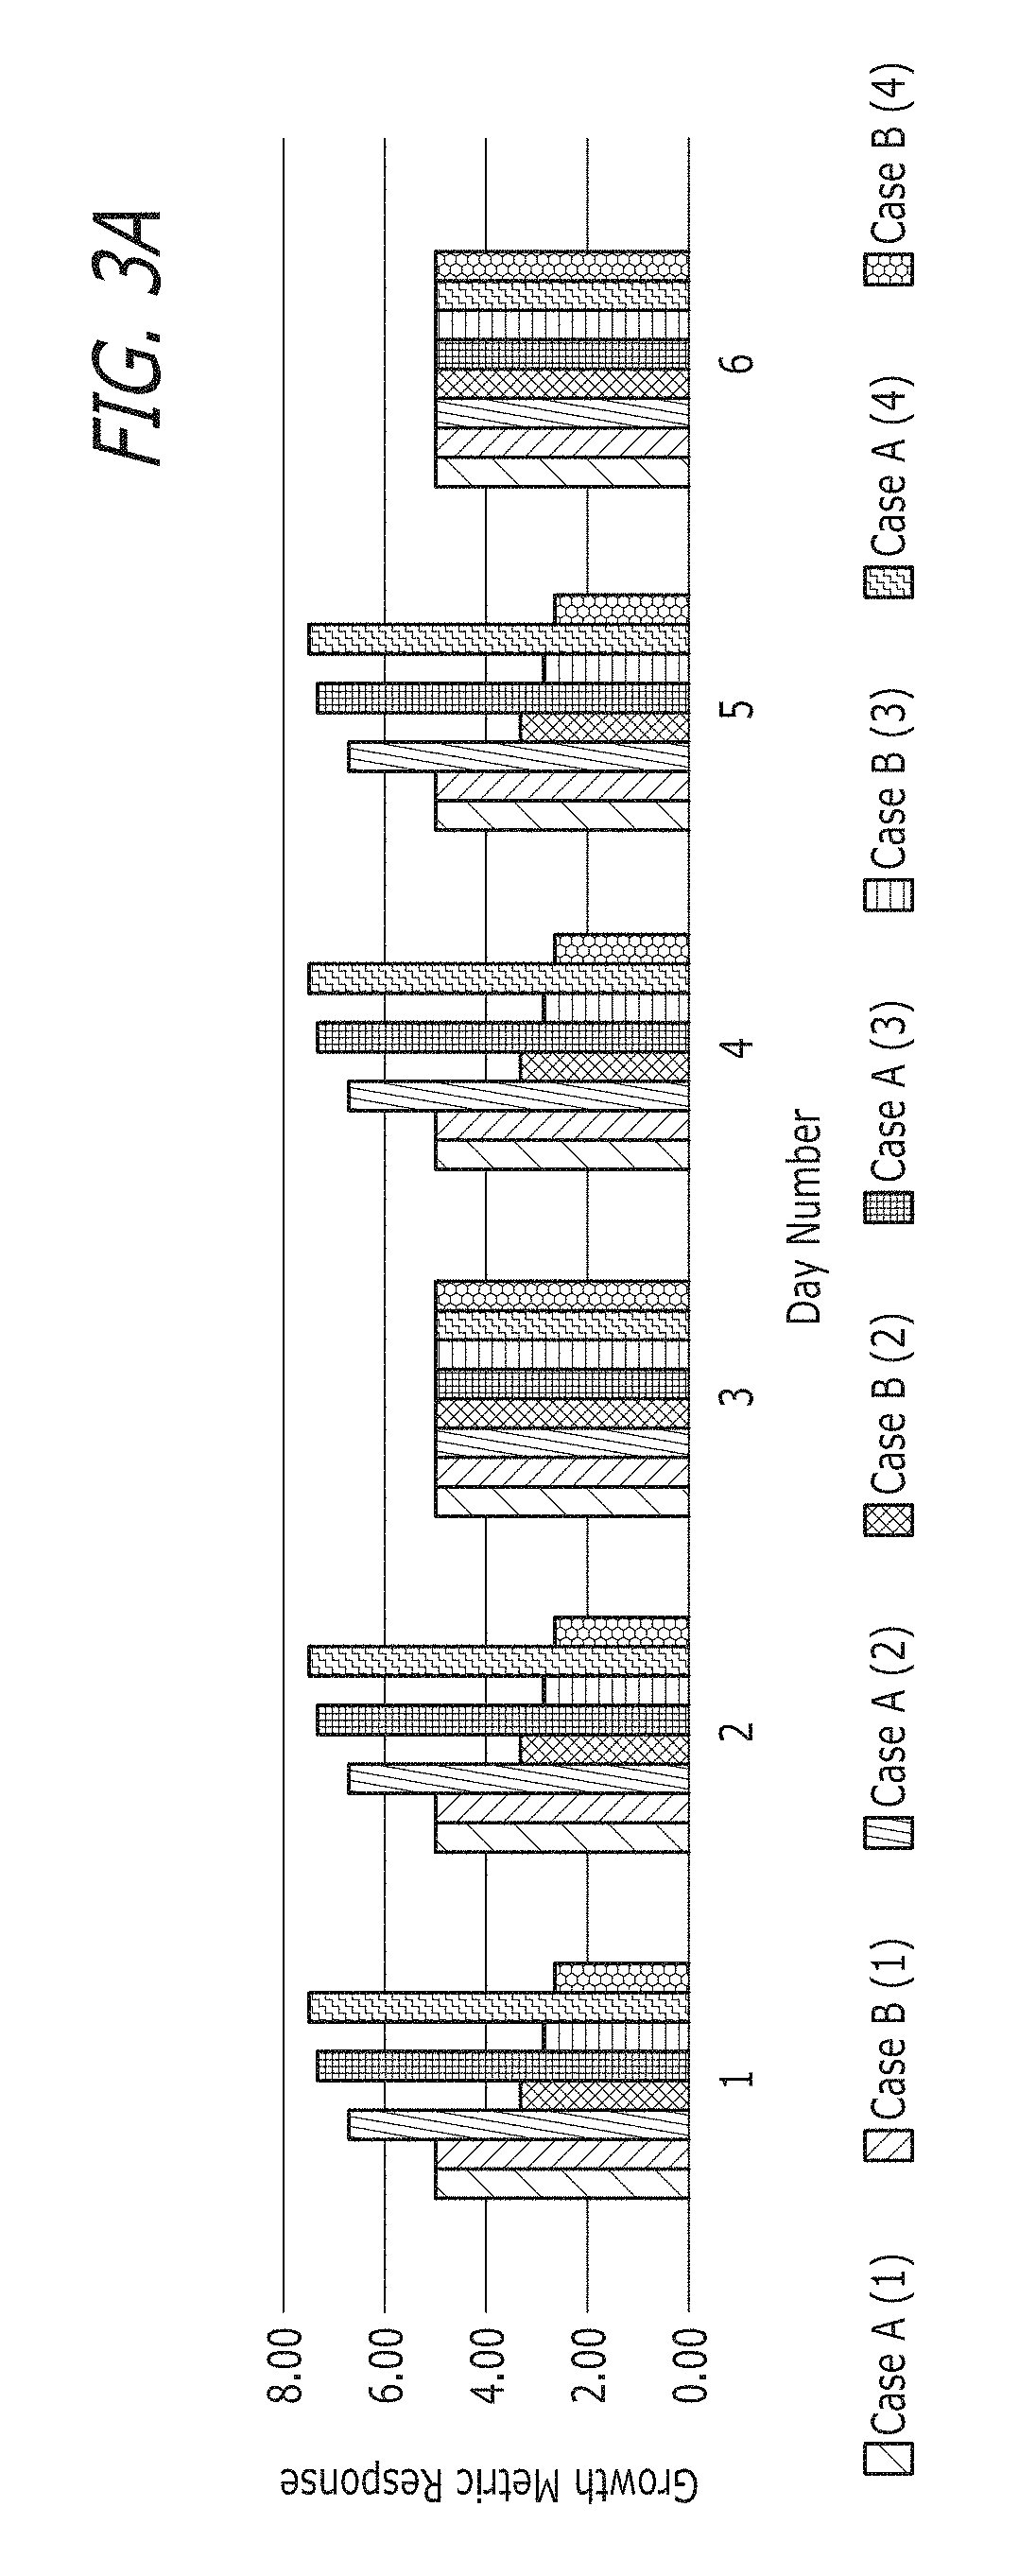
[0070]The technique as discussed in the preceding examples uses ANNs for both the primary and corrective models 123 and 128 in the iterative model development process. While this is a powerful implementation of the technique, ANNs are not a necessary requirement for applying the general concept. Similar steps can be taken to develop models using simpler underlying models, as demonstrated by the simple illustrative example of FIG. 3. For example, it is possible to select a predictive variable 106, the time-varying values of which impact some arbitrary process to be modeled. Starting with a flat response function (i.e., a model that produces the same output irrespective of the value of the predictive input variable 106), the output values, as aggregated to be comparable with a validating data point, can be compared to the validating data point. The resulting information on differences between the predicted (output) values and the validating data point can then be assigned back to ‘buc...


PUM


Abstract

A multi-step iterative process for simulating complex agricultural situations where limited sets of data are available for such problems first predicts an outcome for each situation in a particular dataset, using initial assumptions of an applied primary model. The process then uses the errors across these situations to identify where opportunities exist among relevant predictive variables for the model to make changes to a response to such predictor variables to reduce the errors when averaged across all situations. The process then develops a correction model to identify adjustments based on combinations of the predictive variables, and applies the adjustments to the primary model to induce an altered outcome.

Description

CROSS-REFERENCE TO RELATED PATENT APPLICATION(S)[0001]This patent application claims priority to U.S. provisional application 62 / 543,638, filed on Aug. 10, 2017, the contents of which are incorporated in their entirety herein. In accordance with 37 C.F.R. § 1.76, a claim of priority is included in an Application Data Sheet filed concurrently herewith.FIELD OF THE INVENTION[0002]The present invention relates to precision agriculture. Specifically, the present invention relates to a technique for generating complex simulation models, including artificial intelligence (AI) models, for analyzing a wide range of agricultural problems, where limited sets of data are available.BACKGROUND OF THE INVENTION[0003]A major obstacle to the successful application of ‘big data’ modeling to agricultural problems has been that data related to the agricultural processes to be simulated are often only recorded at a small number of times (and very often, just once) during any one specific case of the pr...

Claims


Application Information

Patent Timeline
Patent Type & Authority Applications(United States)
IPC IPC(8): G06F17/50G06Q50/02G06F17/18G06N3/04
CPCG06F17/5009G06Q50/02G06F17/18G06N3/04G06N3/084G06F30/20G06N3/045
Inventor MEWES, JOHN J.SALENTINY, DUSTIN M.
Owner DTN LLC
Why Eureka
Try Eureka