
Calibration curve setting method used for drug analysis

a calibration curve and curve setting technology, applied in the direction of material analysis, color/spectral properties measurement, instruments, etc., can solve the problems of long analysis time, high running cost, and need to perform destructive analysis, and achieve the effect of improving the reliability of calibration curve, short analysis time, and high chemical discrimination ability

Active Publication Date: 2019-12-05
HORIBA LTD
View PDF1 Cites 2 Cited by
  • Summary
  • Abstract
  • Description
  • Claims
  • Application Information

AI Technical Summary

Benefits of technology

The present invention improves the accuracy of analyzing drugs using transmission Raman spectroscopy without affecting its benefits such as being non-destructive, having high chemical discrimination ability, and being fast.

Problems solved by technology

On the other hand, in a technique of HPLC (high performance liquid chromatography) used in a process monitoring procedure in the conventional pharmaceutical production process, it is necessary to perform destructive analysis.
Therefore, there is a drawback that a running cost becomes high and a long analysis time is required, and it is difficult to meet the aforementioned demand.
Therefore, it is difficult to obtain required qualitative accuracy and quantitative accuracy.
In addition, although the analysis time is also a little short compared to that in HPLC, it is doubtful as to whether productivity of the pharmaceuticals can be sufficiently improved.
Furthermore, nondestructive analysis can be performed and analysis time is very short.

Method used


Image

  • Calibration curve setting method used for drug analysis
  • Calibration curve setting method used for drug analysis
  • Calibration curve setting method used for drug analysis

Examples


Embodiment Construction

[0027]In the following, one embodiment of the present invention will be described with reference to the drawings.

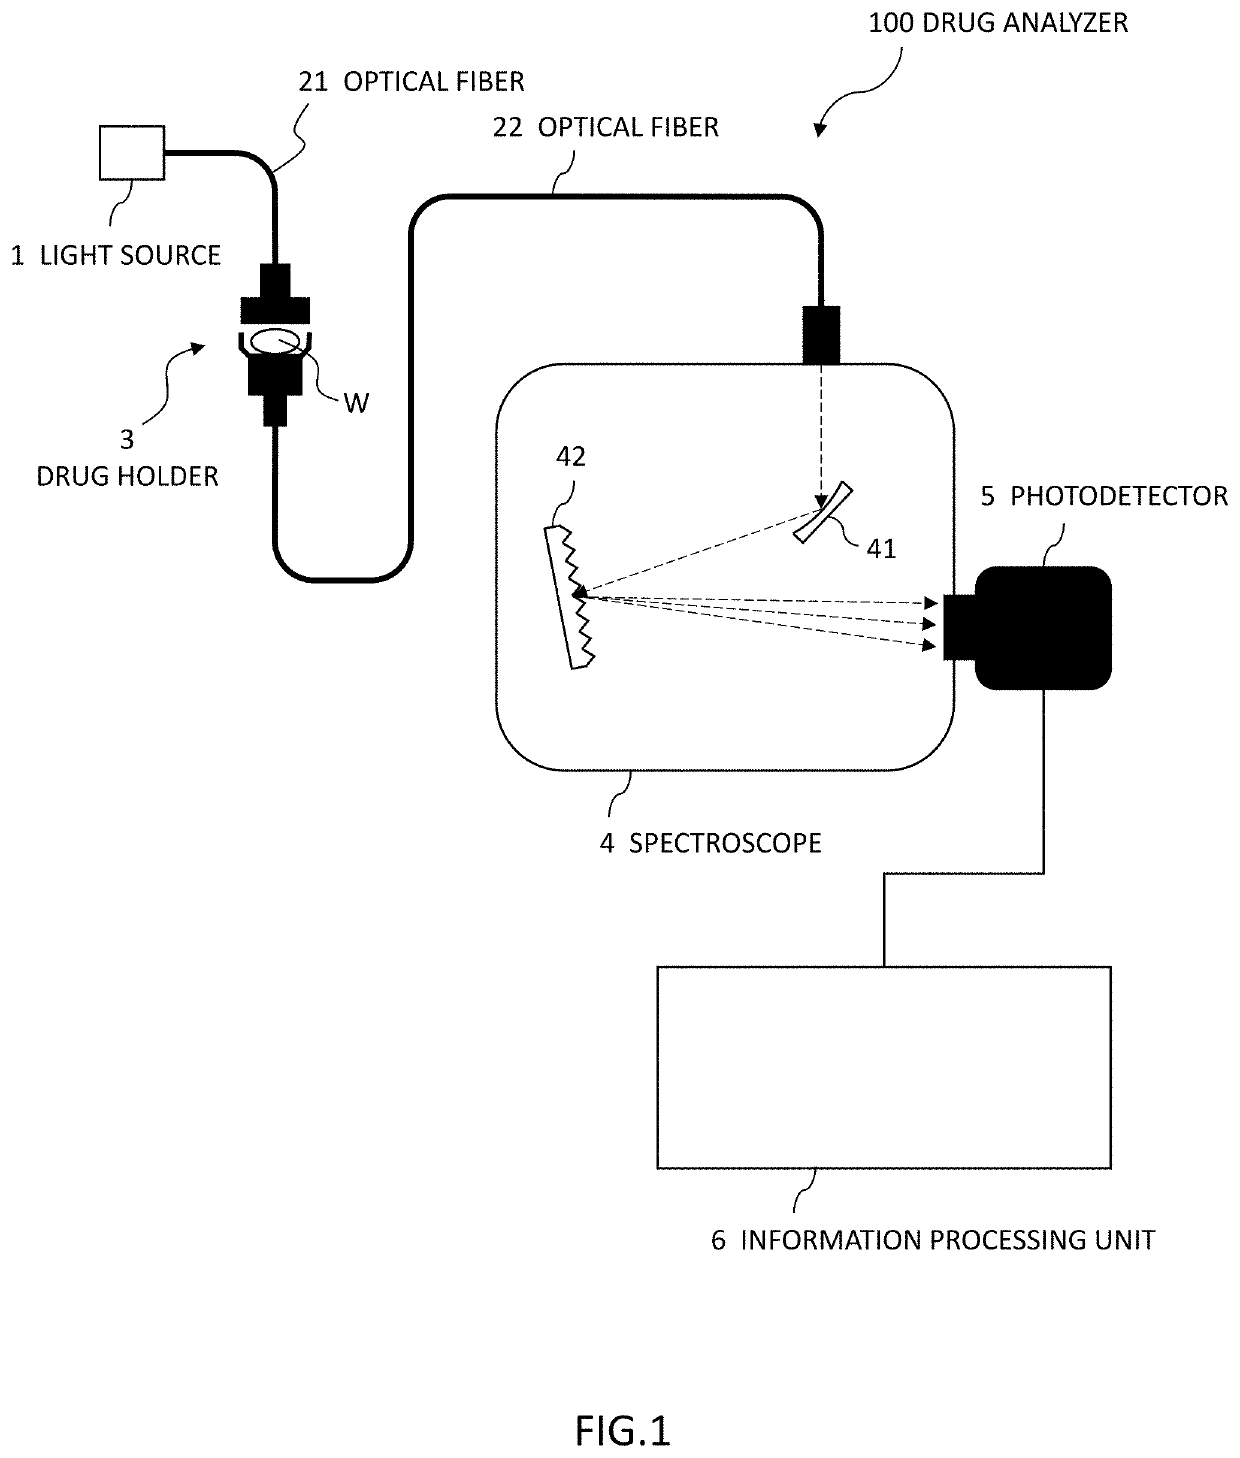
[0028]The drug analyzer 100 according to the present embodiment is intended to analyze and quantify a specific component contained in a drug W. As shown in FIG. 1, the drug analyzer 100 includes: a drug holder 3 for holding the drug W a light source 1 for irradiating the drug held by the drug holder 3 with near-infrared laser light as inspection light; a spectroscope 4 for spectrally dispersing transmission Raman light generated upon irradiation of the inspection light; a photodetector 5 for detecting intensity at each wavelength of the transmission Raman light spectrally dispersed by the spectroscope 4 and an information processing unit 6 for obtaining transmission Raman spectrum data from an output signal of the photodetector 5 and analyzing the data to calculate a concentration of the specific component. Note that, although a “drug” mentioned here is a pharmaceutical t...


PUM

PropertyMeasurementUnit
transmission Raman spectrumaaaaaaaaaa
transmission Ramanaaaaaaaaaa
Ramanaaaaaaaaaa

Abstract

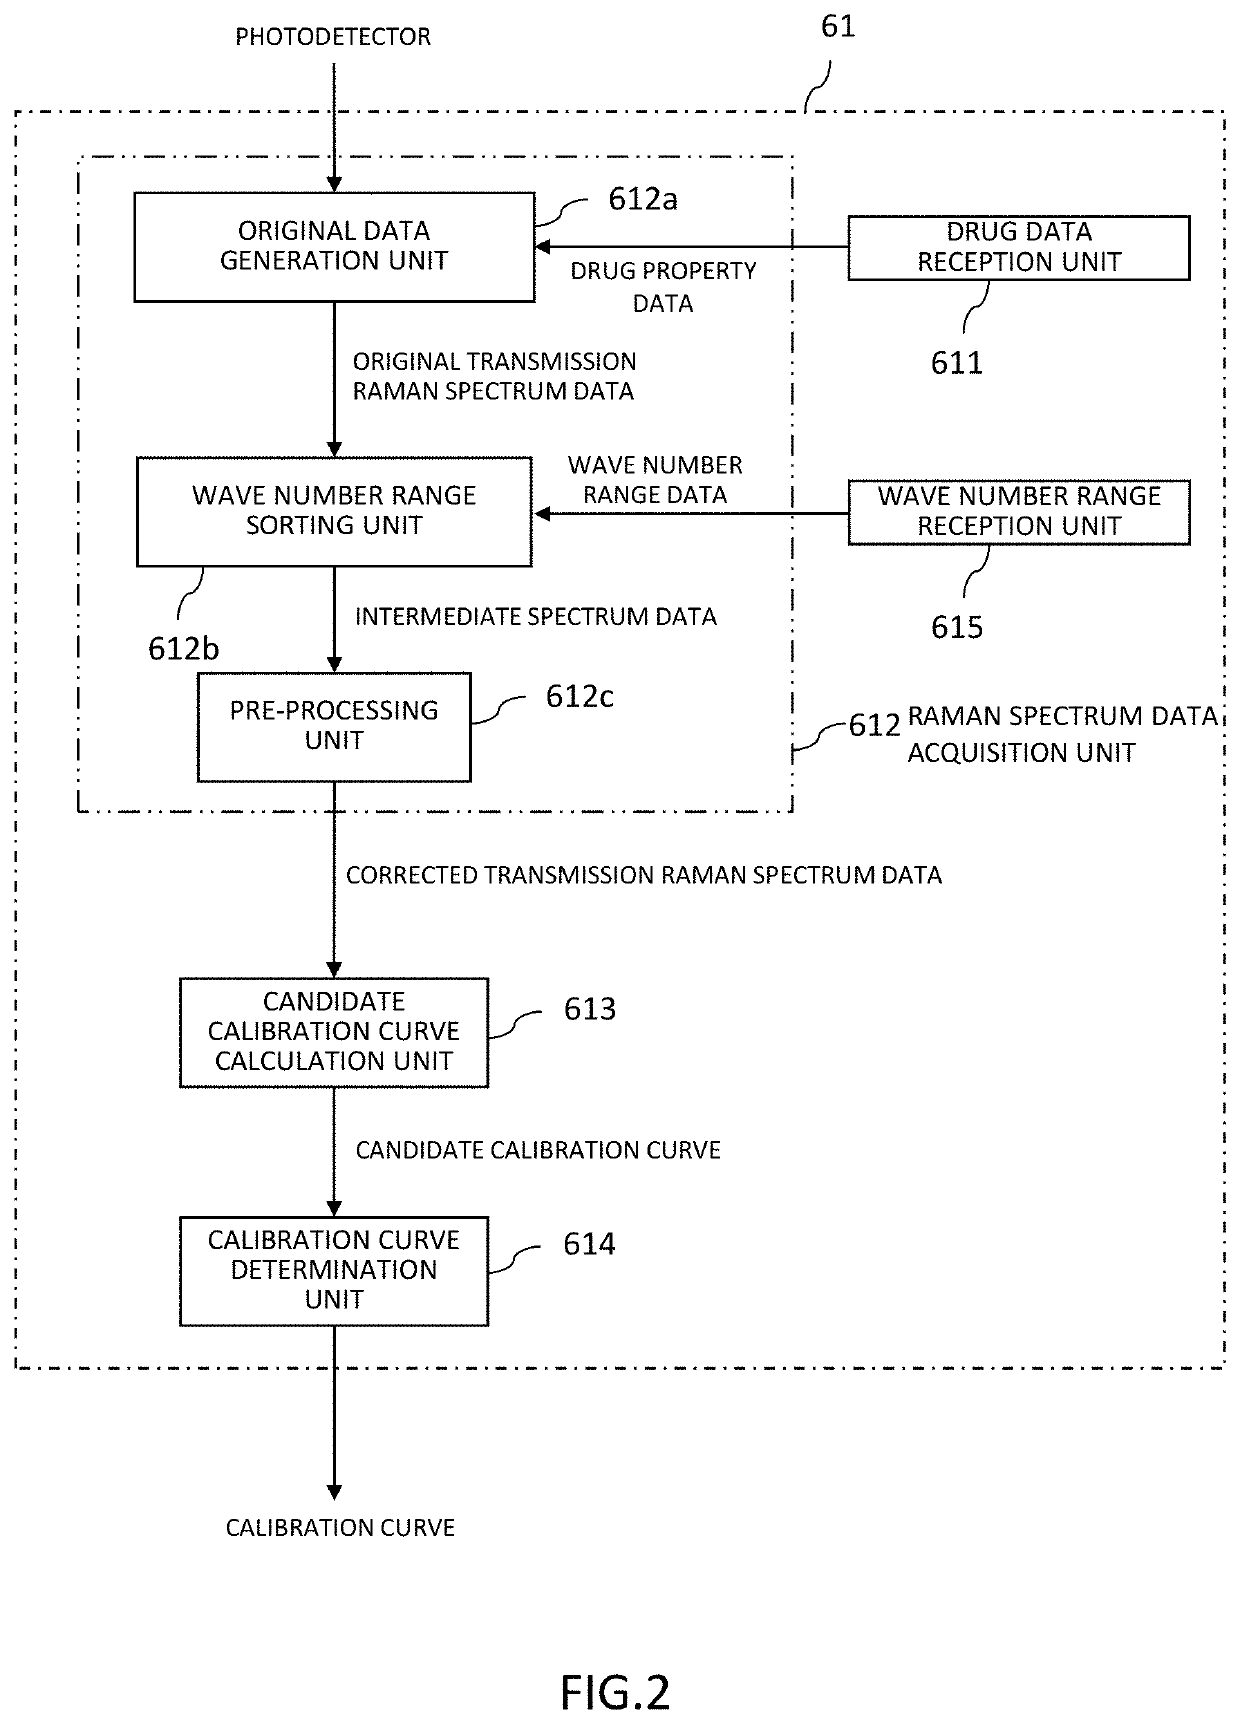
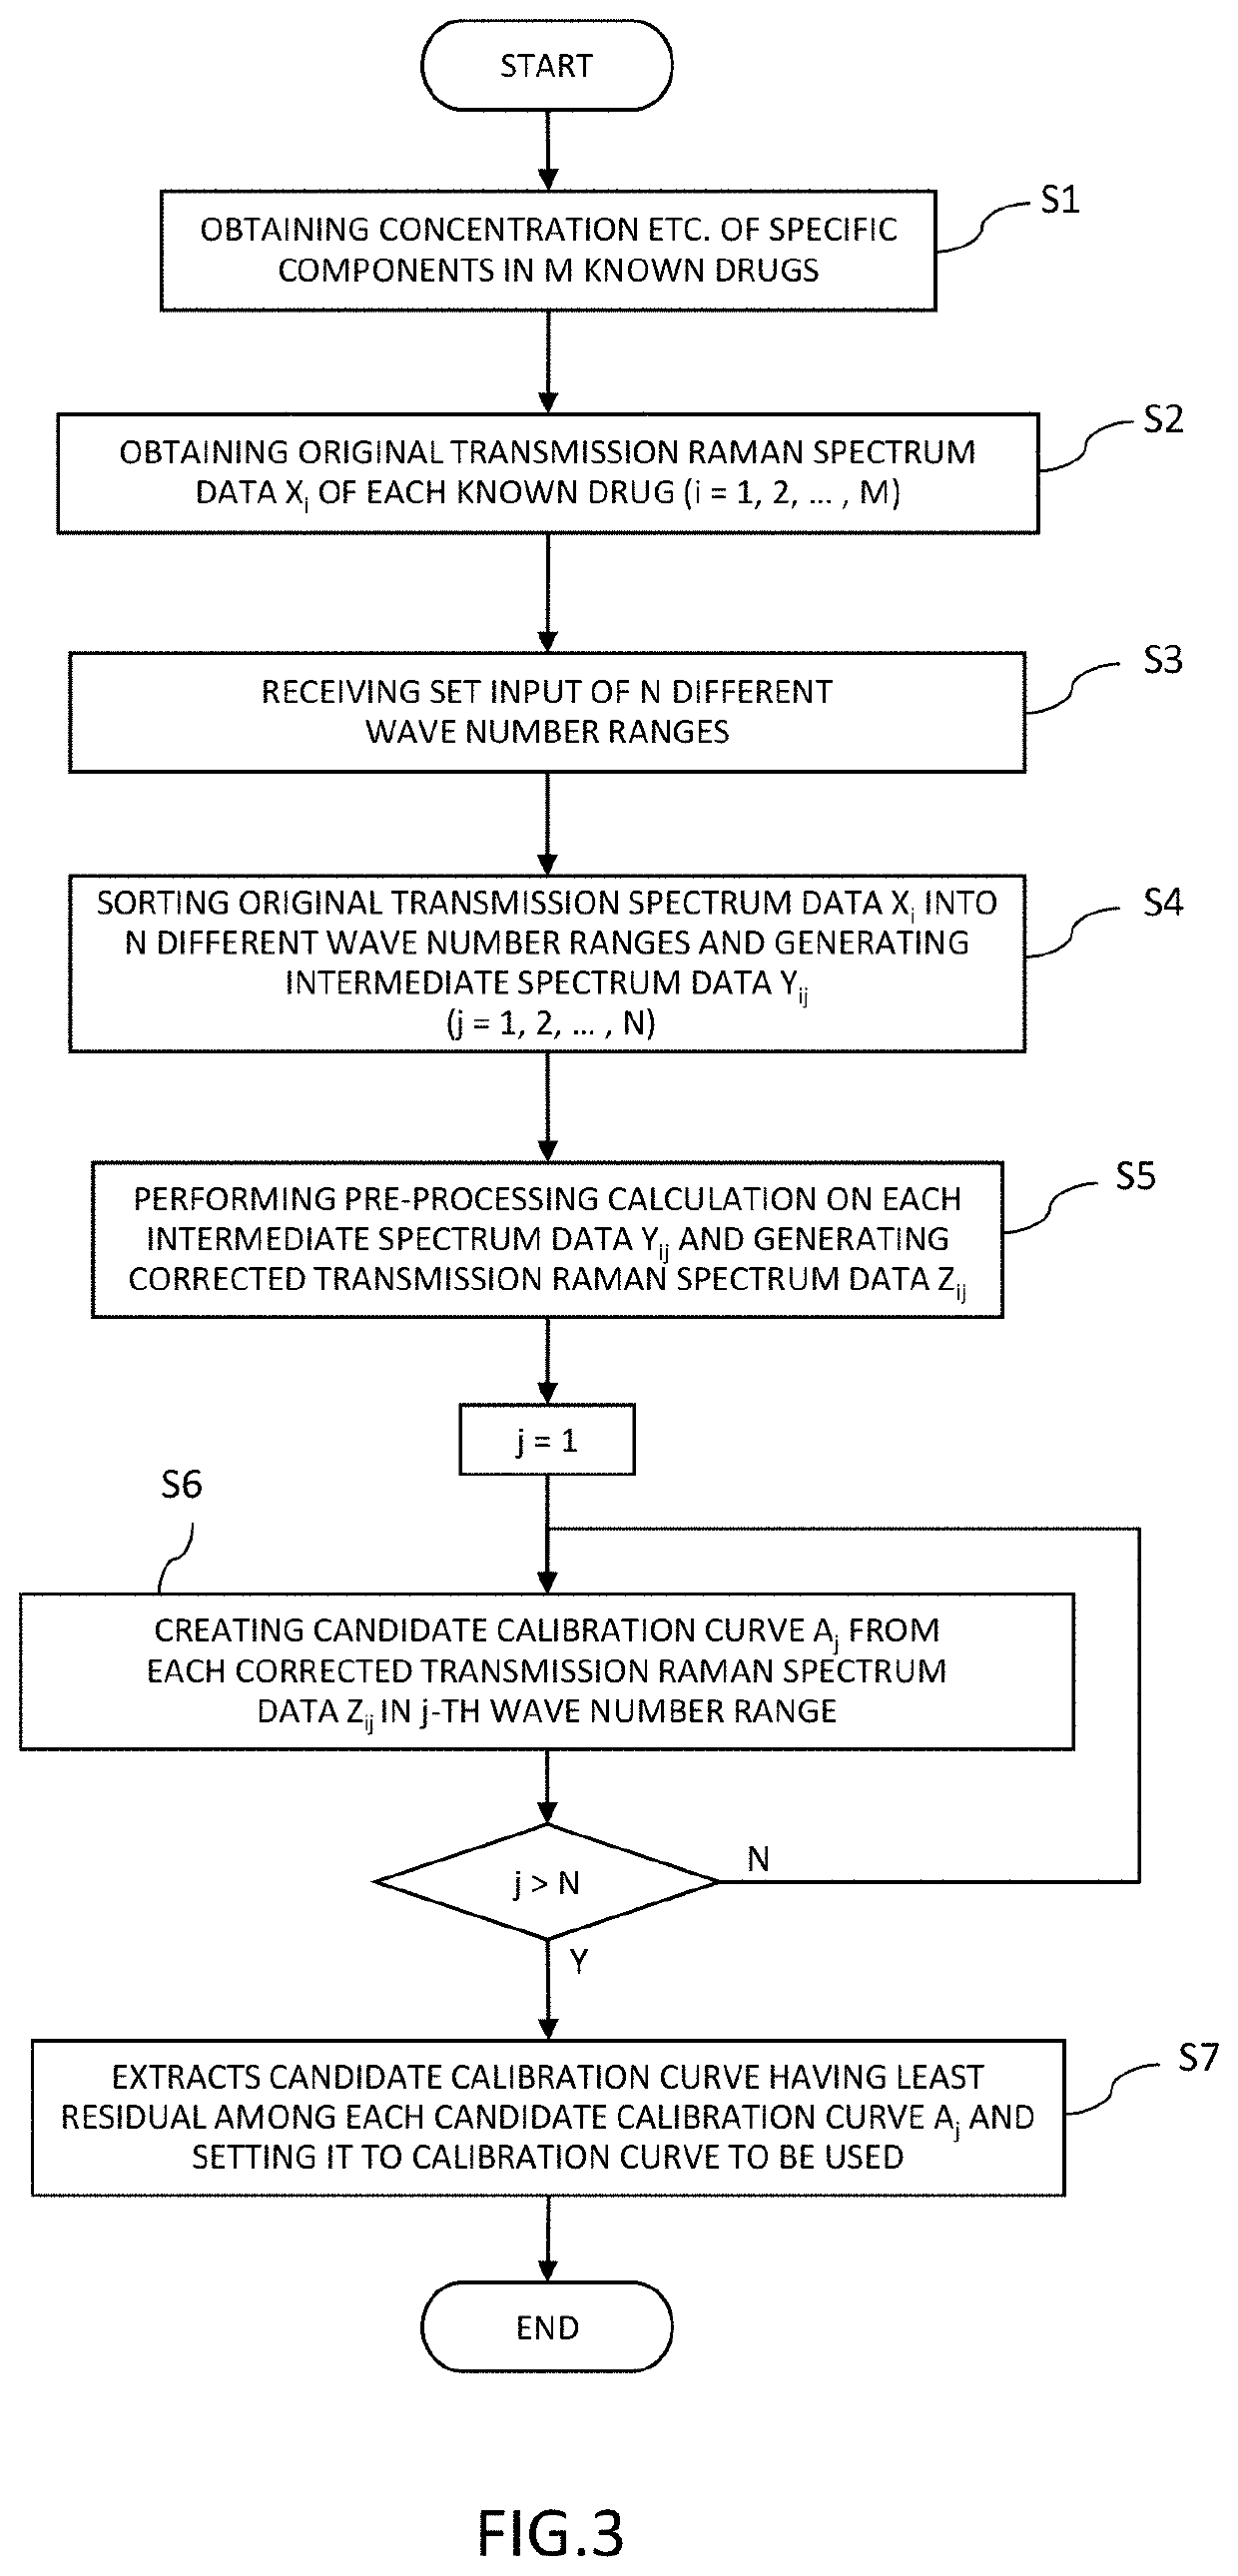
A calibration curve setting method used at the time of quantitatively analyzing specific components in a drug by a transmission Raman spectrum, the method comprising the steps of: obtaining respective transmission Raman spectra of a plurality of different wave number ranges including Raman hands corresponding to the specific components of a plurality of known drugs of which concentrations or amounts of the specific components are known and the concentrations or the amounts are different from each other; calculating candidate calibration curves which are candidates for calibration curves used for the quantitative analysis respectively from a plurality of transmission. Raman spectra in each of the wave number ranges; and using the most probable candidate calibration curve as a calibration curve for the quantitative analysis of the specific components, among the respective candidate calibration curves.

Description

CROSS REFERENCE TO RELATED APPLICATION[0001]The present application claims priority of JP 2018-102139, filed May 29, 2018, the priority of this application is hereby claimed and this application is incorporated herein by reference.TECHNICAL FIELD[0002]The present invention relates to a method of setting a calibration curve used for quantitatively analyzing a specific component of a drug such as a pharmaceutical, medicament and the like, based on transmission Raman light generated at the time of irradiating the drug with inspection light.BACKGROUND ART[0003]In recent years, in a pharmaceutical production process, there has been increasing a demand for performing a process monitoring procedure by a nondestructive and rapid analysis method to improve productivity.[0004]On the other hand, in a technique of HPLC (high performance liquid chromatography) used in a process monitoring procedure in the conventional pharmaceutical production process, it is necessary to perform destructive anal...

Claims


Application Information

Patent Timeline
Patent Type & Authority Applications(United States)
IPC IPC(8): G01N21/27G01N21/65G01N33/15
CPCG01N21/65G01N2021/3133G01N21/274G01D5/347G01N2201/12761G06F17/18G01N33/15G01N2201/1293
Inventor ISO, EISHIKASHIWAGI, SHINSUKE
Owner HORIBA LTD
Learn More