System and method for geologically-enhanced magnetic resonance imaging logs

Inactive Publication Date: 2001-07-03
HALLIBURTON ENERGY SERVICES INC
View PDF103 Cites 67 Cited by
  • Summary
  • Abstract
  • Description
  • Claims
  • Application Information

AI Technical Summary

Problems solved by technology
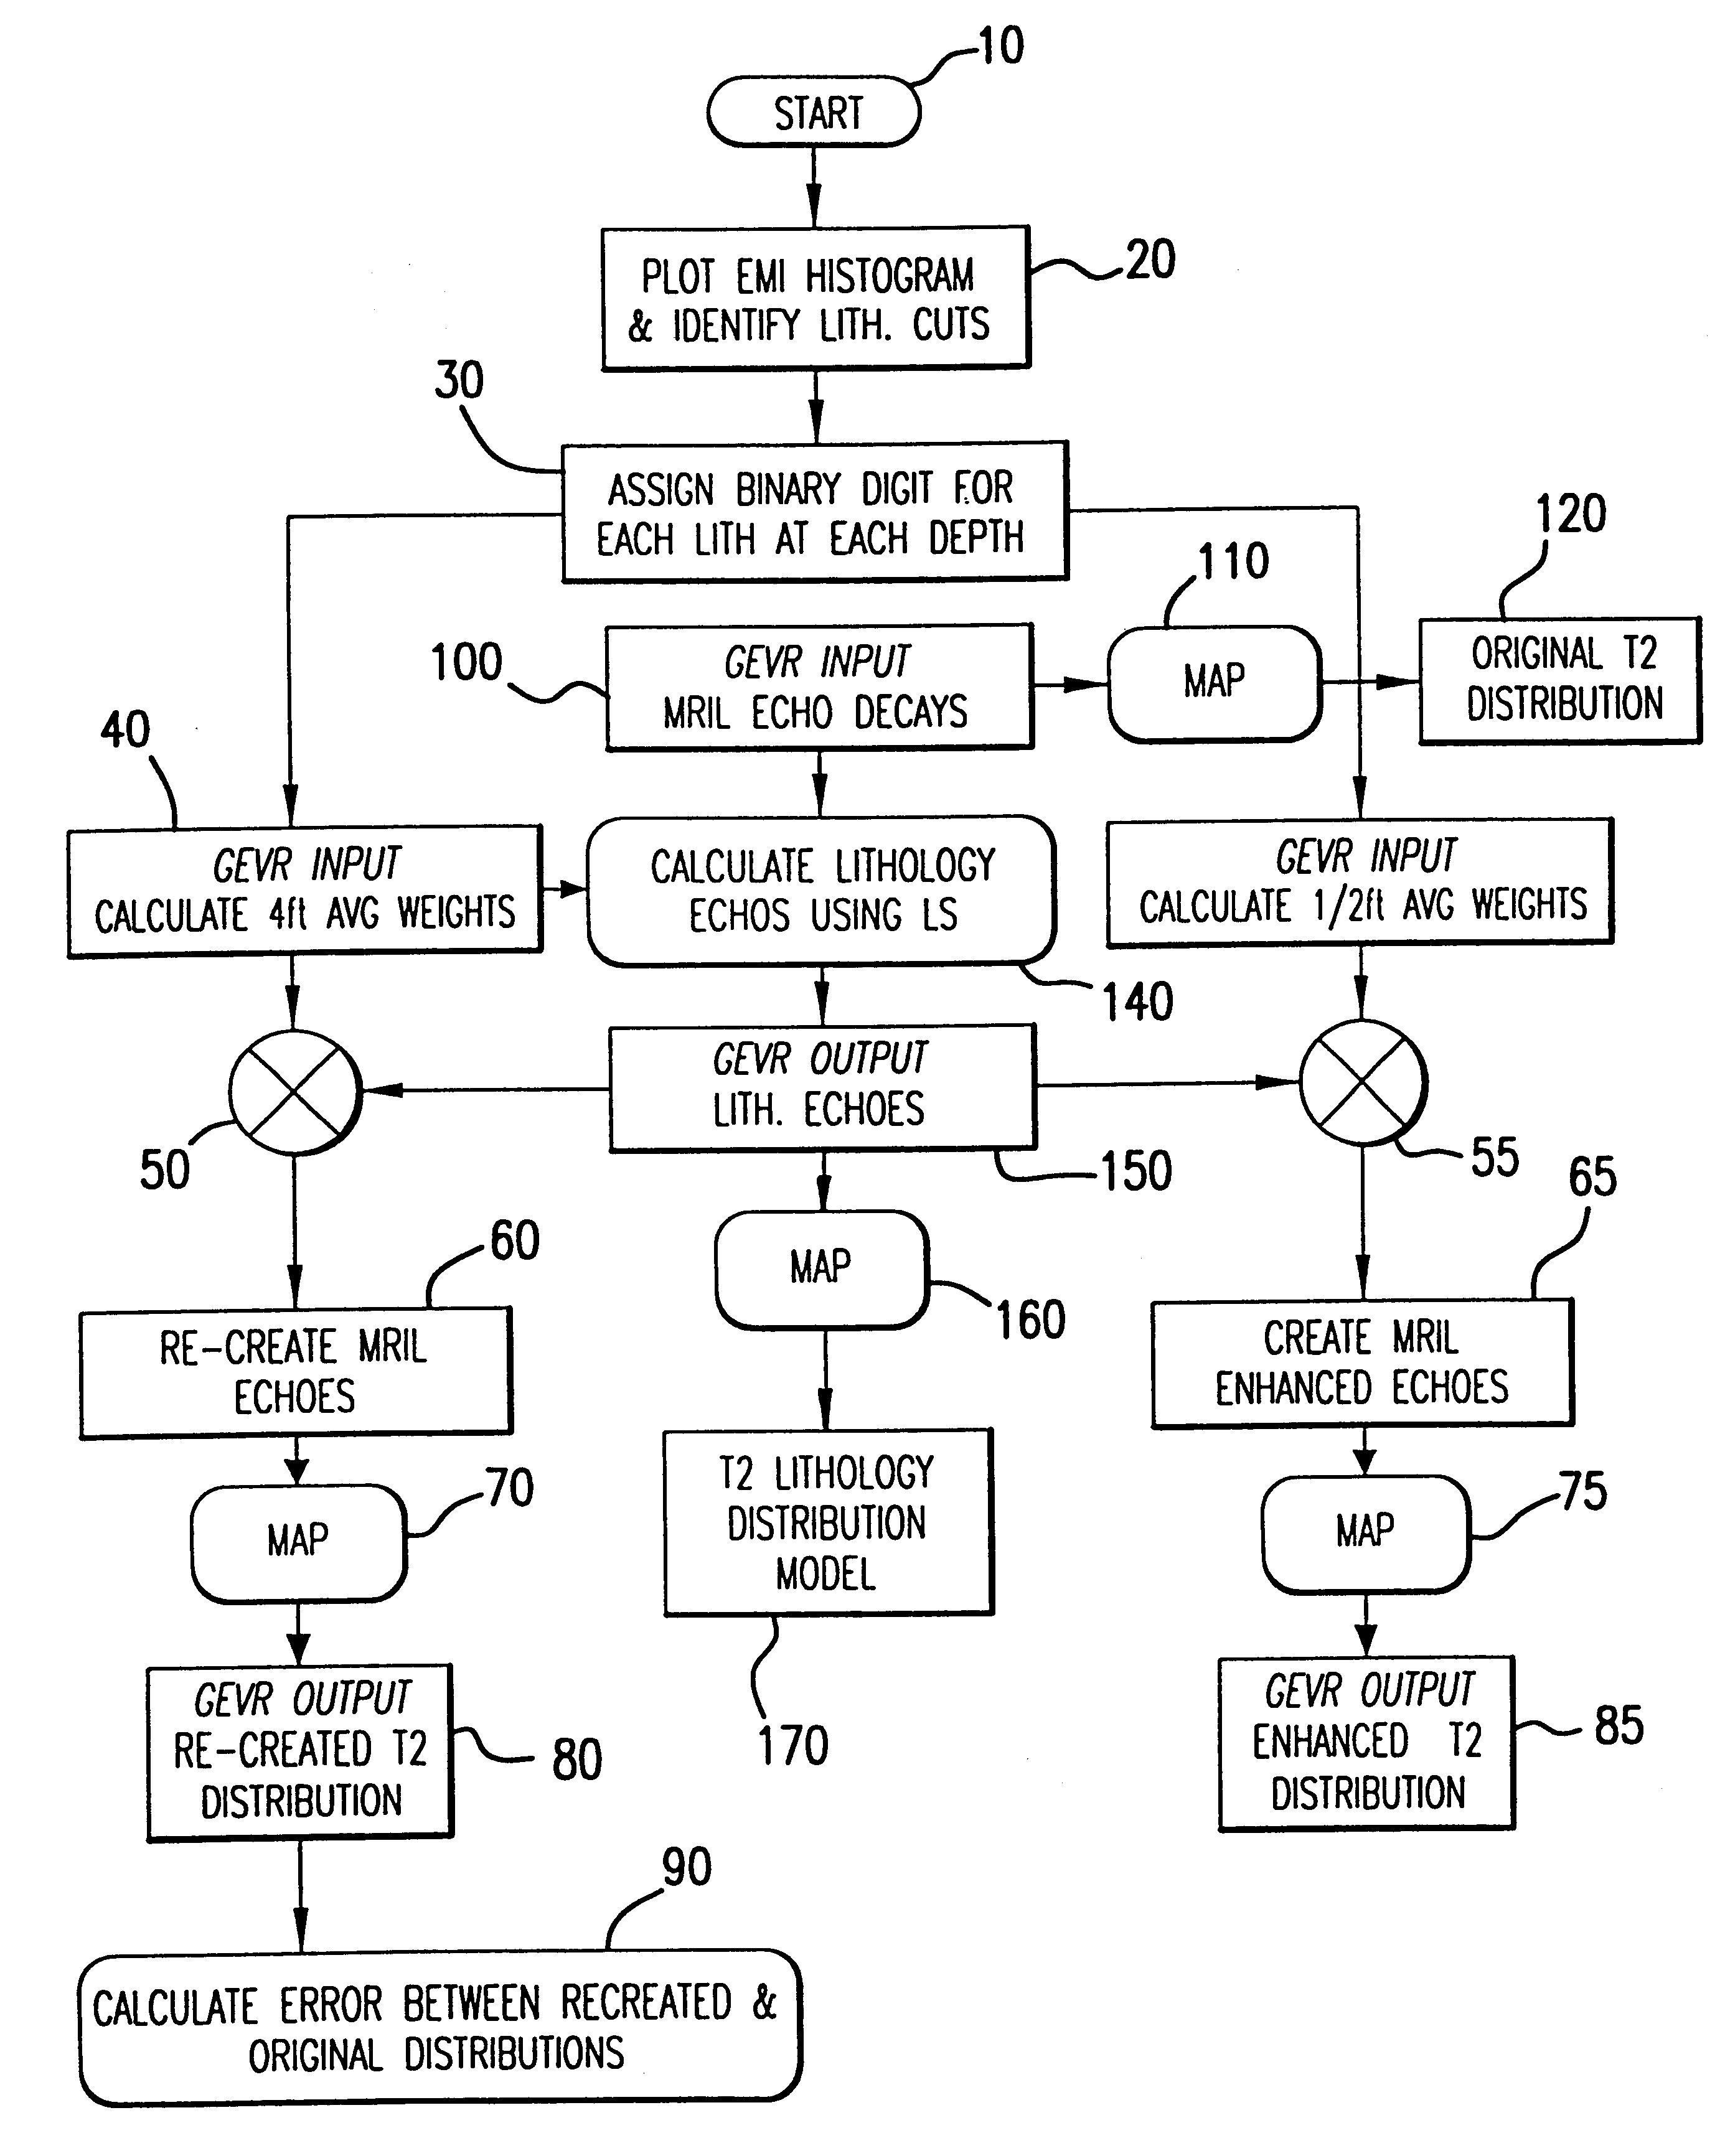
While prior art methods, such as discussed above, address to some extent the issues associated with generating high-resolution petrophysical maps, they have a number of drawbacks, some of which are discussed below, and more specifically fail to exploit information available from time-dependent log sequences, such as NMR logs.
Generally, however, the process

Method used


Image

  • System and method for geologically-enhanced magnetic resonance imaging logs
  • System and method for geologically-enhanced magnetic resonance imaging logs
  • System and method for geologically-enhanced magnetic resonance imaging logs

Examples


example 1

Field Fort Worth test well

1. GEVR processing with MRIL and EMI data

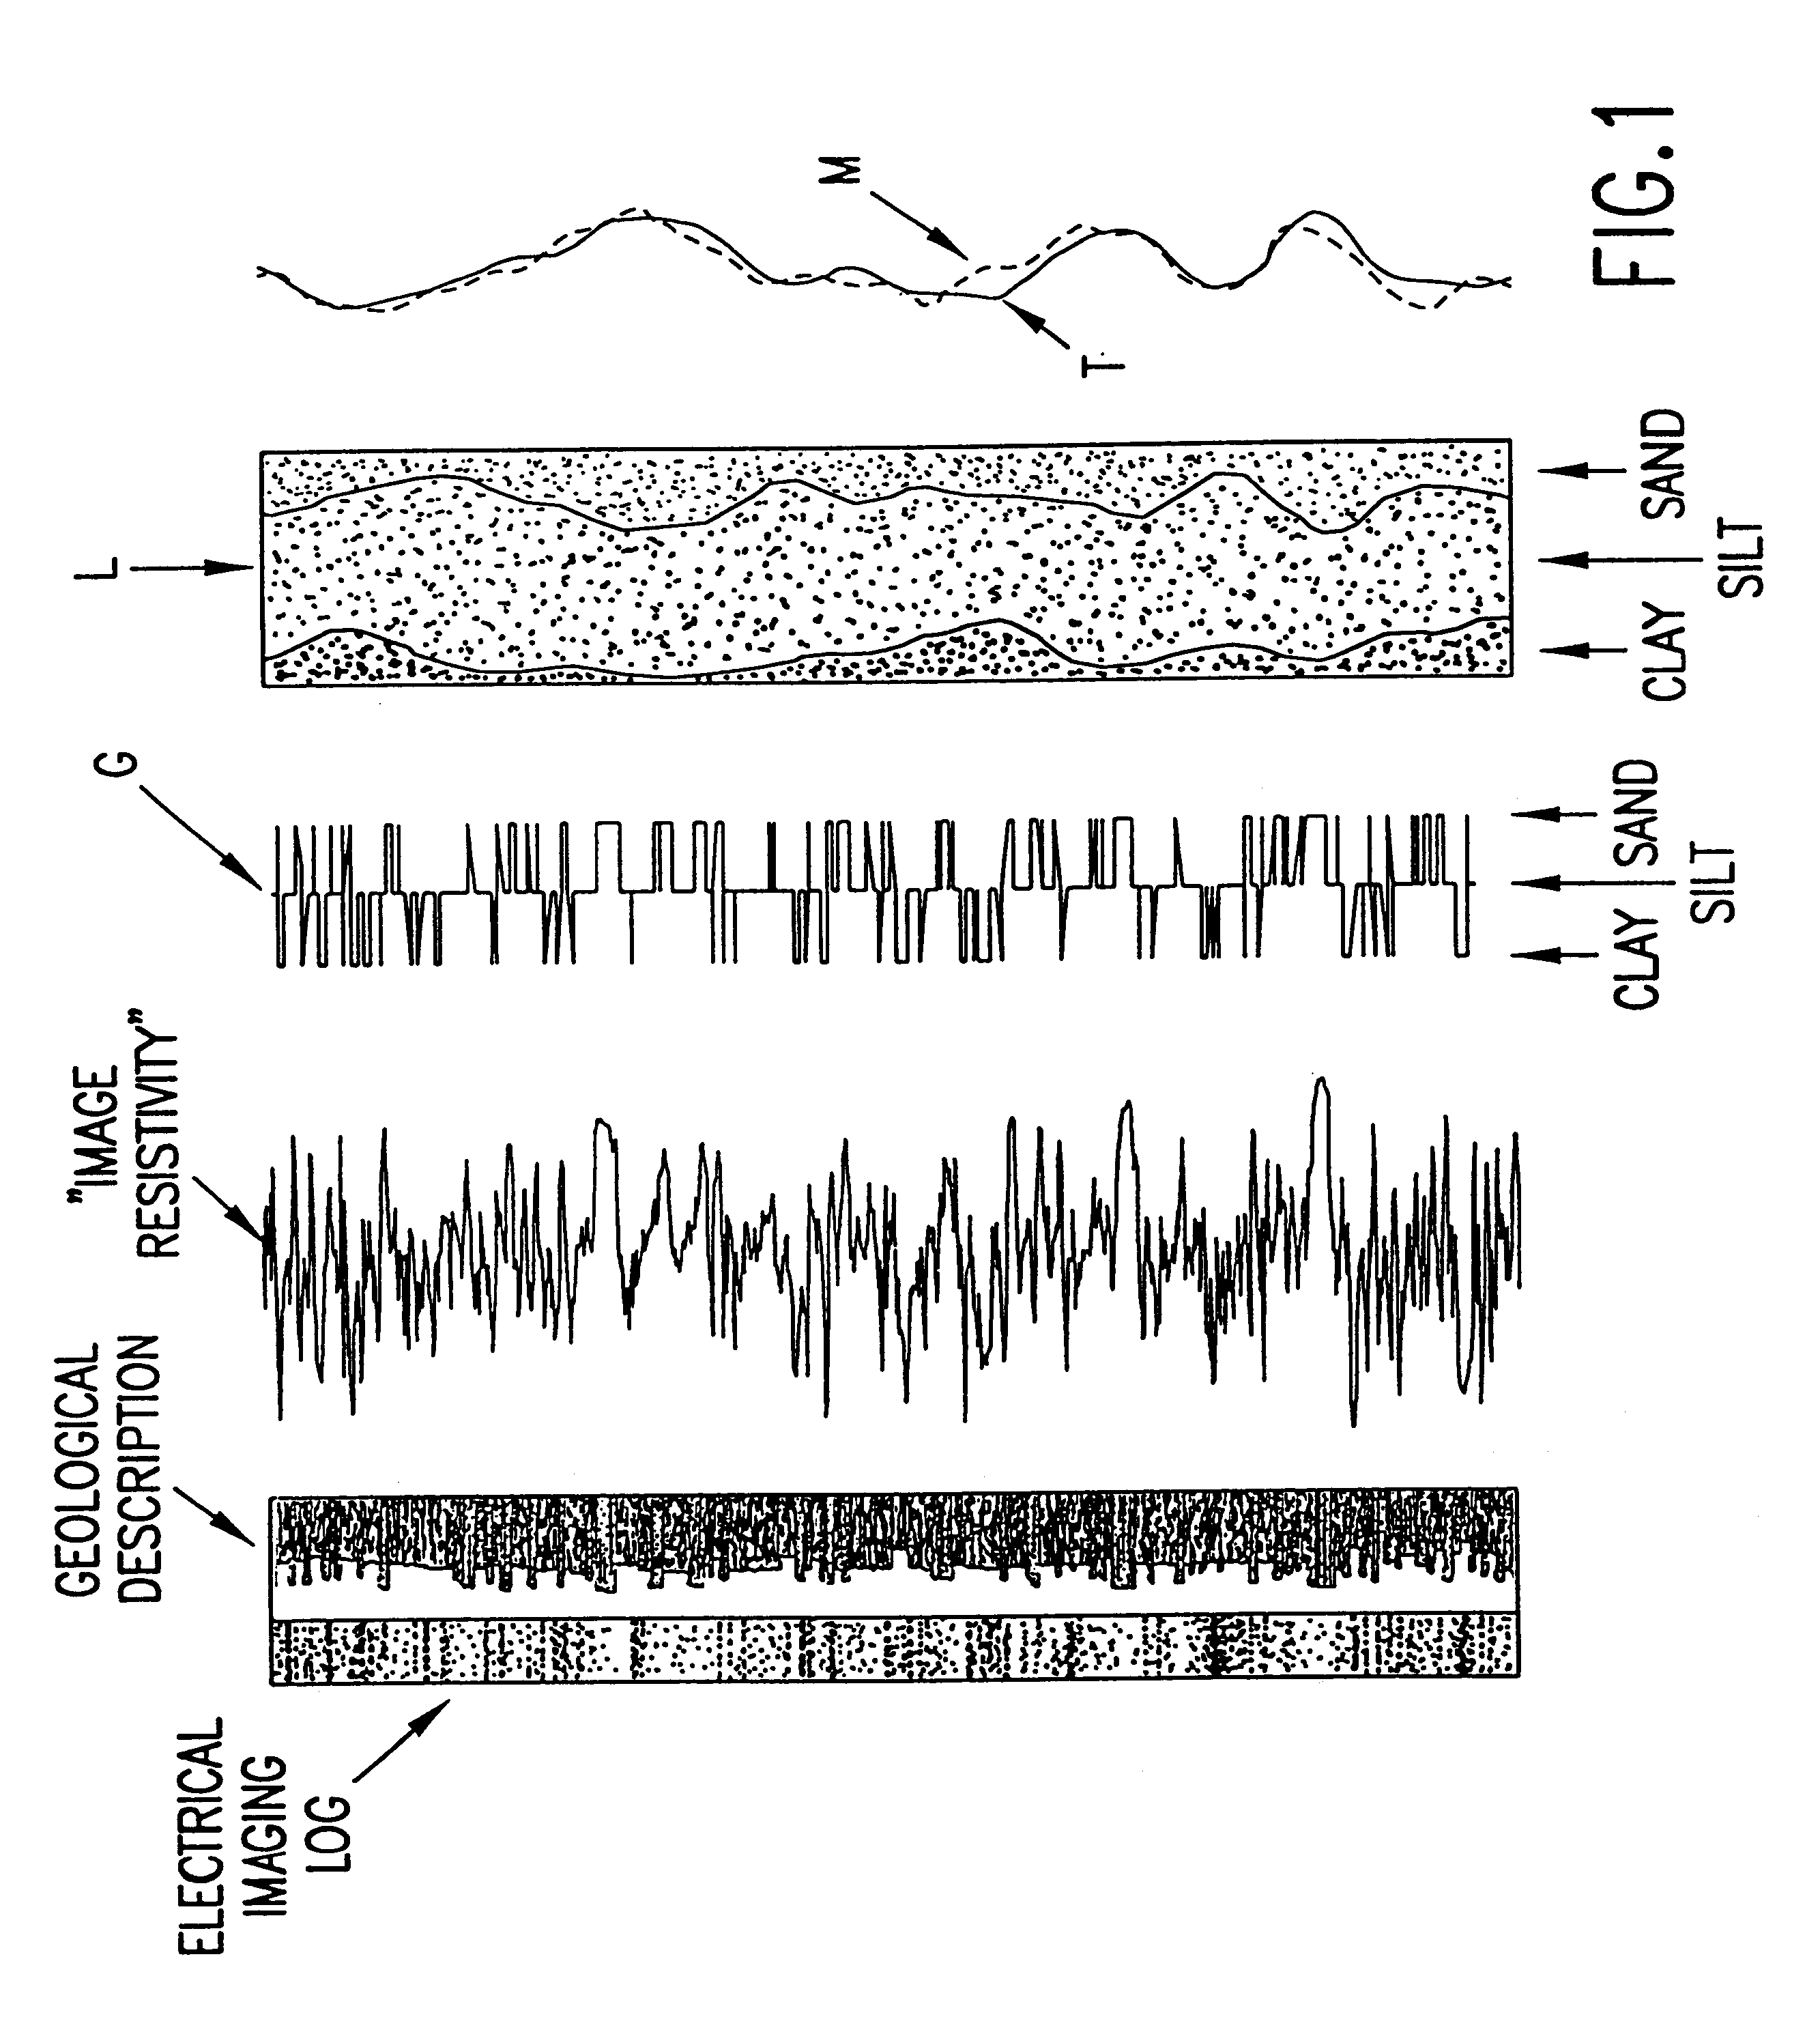
MRIL, EMI, and other conventional suite of logs were run in a Halliburton test well in Fortworth, Tex. FIG. 8A shows the EMI image log for the depth interval between 500 and 525 ft depth, indicating possible lamination. FIG. 8B shows the processed MRIL data (T.sub.2 -bin distribution and average T.sub.2) and matched EMI resistivity data for the same depth interval. Note that the EMI resistivity data is sampled at every 1 / 10-in. interval. However, the EMI resitivity data in FIG. 8B is matched to the 4ft resolution of MRIL.

FIG. 8C is a cross plot between the matched EFI conductivity and the average T.sub.2. Strong correlation indicated in the cross plot, except for the data from 500-525 ft interval, appears to justify the use of EMI resistivity as a high-resolution lithology measurement tool. FIG. 8D is a histogram of calibrated ESI conductivity collected at every 1 / 10-in. interval. The histogram indicates that there ...

example 2

Field a Gulf of Mexico reservoir

The GEVR processing in accordance with the present invention was also applied to the MRIL and EMI data logged in a Gulf of Mexico reservoir, as illustrated below.

1. Depth interval X422-X427 ft

The MRIL T.sub.2 -average and EMI resistivity averaged over 4-ft are plotted in FIG. 10A. Their cross plot (FIG. 10B) indicates that EMI resistivity may be used as a lithology indicator as the difference in T.sub.2 -average often caused by lithological change. The EMI conductivity histogram of FIG. 10C may indicate the cutoff conductivity to be at 23,000 mmho / m, which is the same as in the case of Fortworth test well.

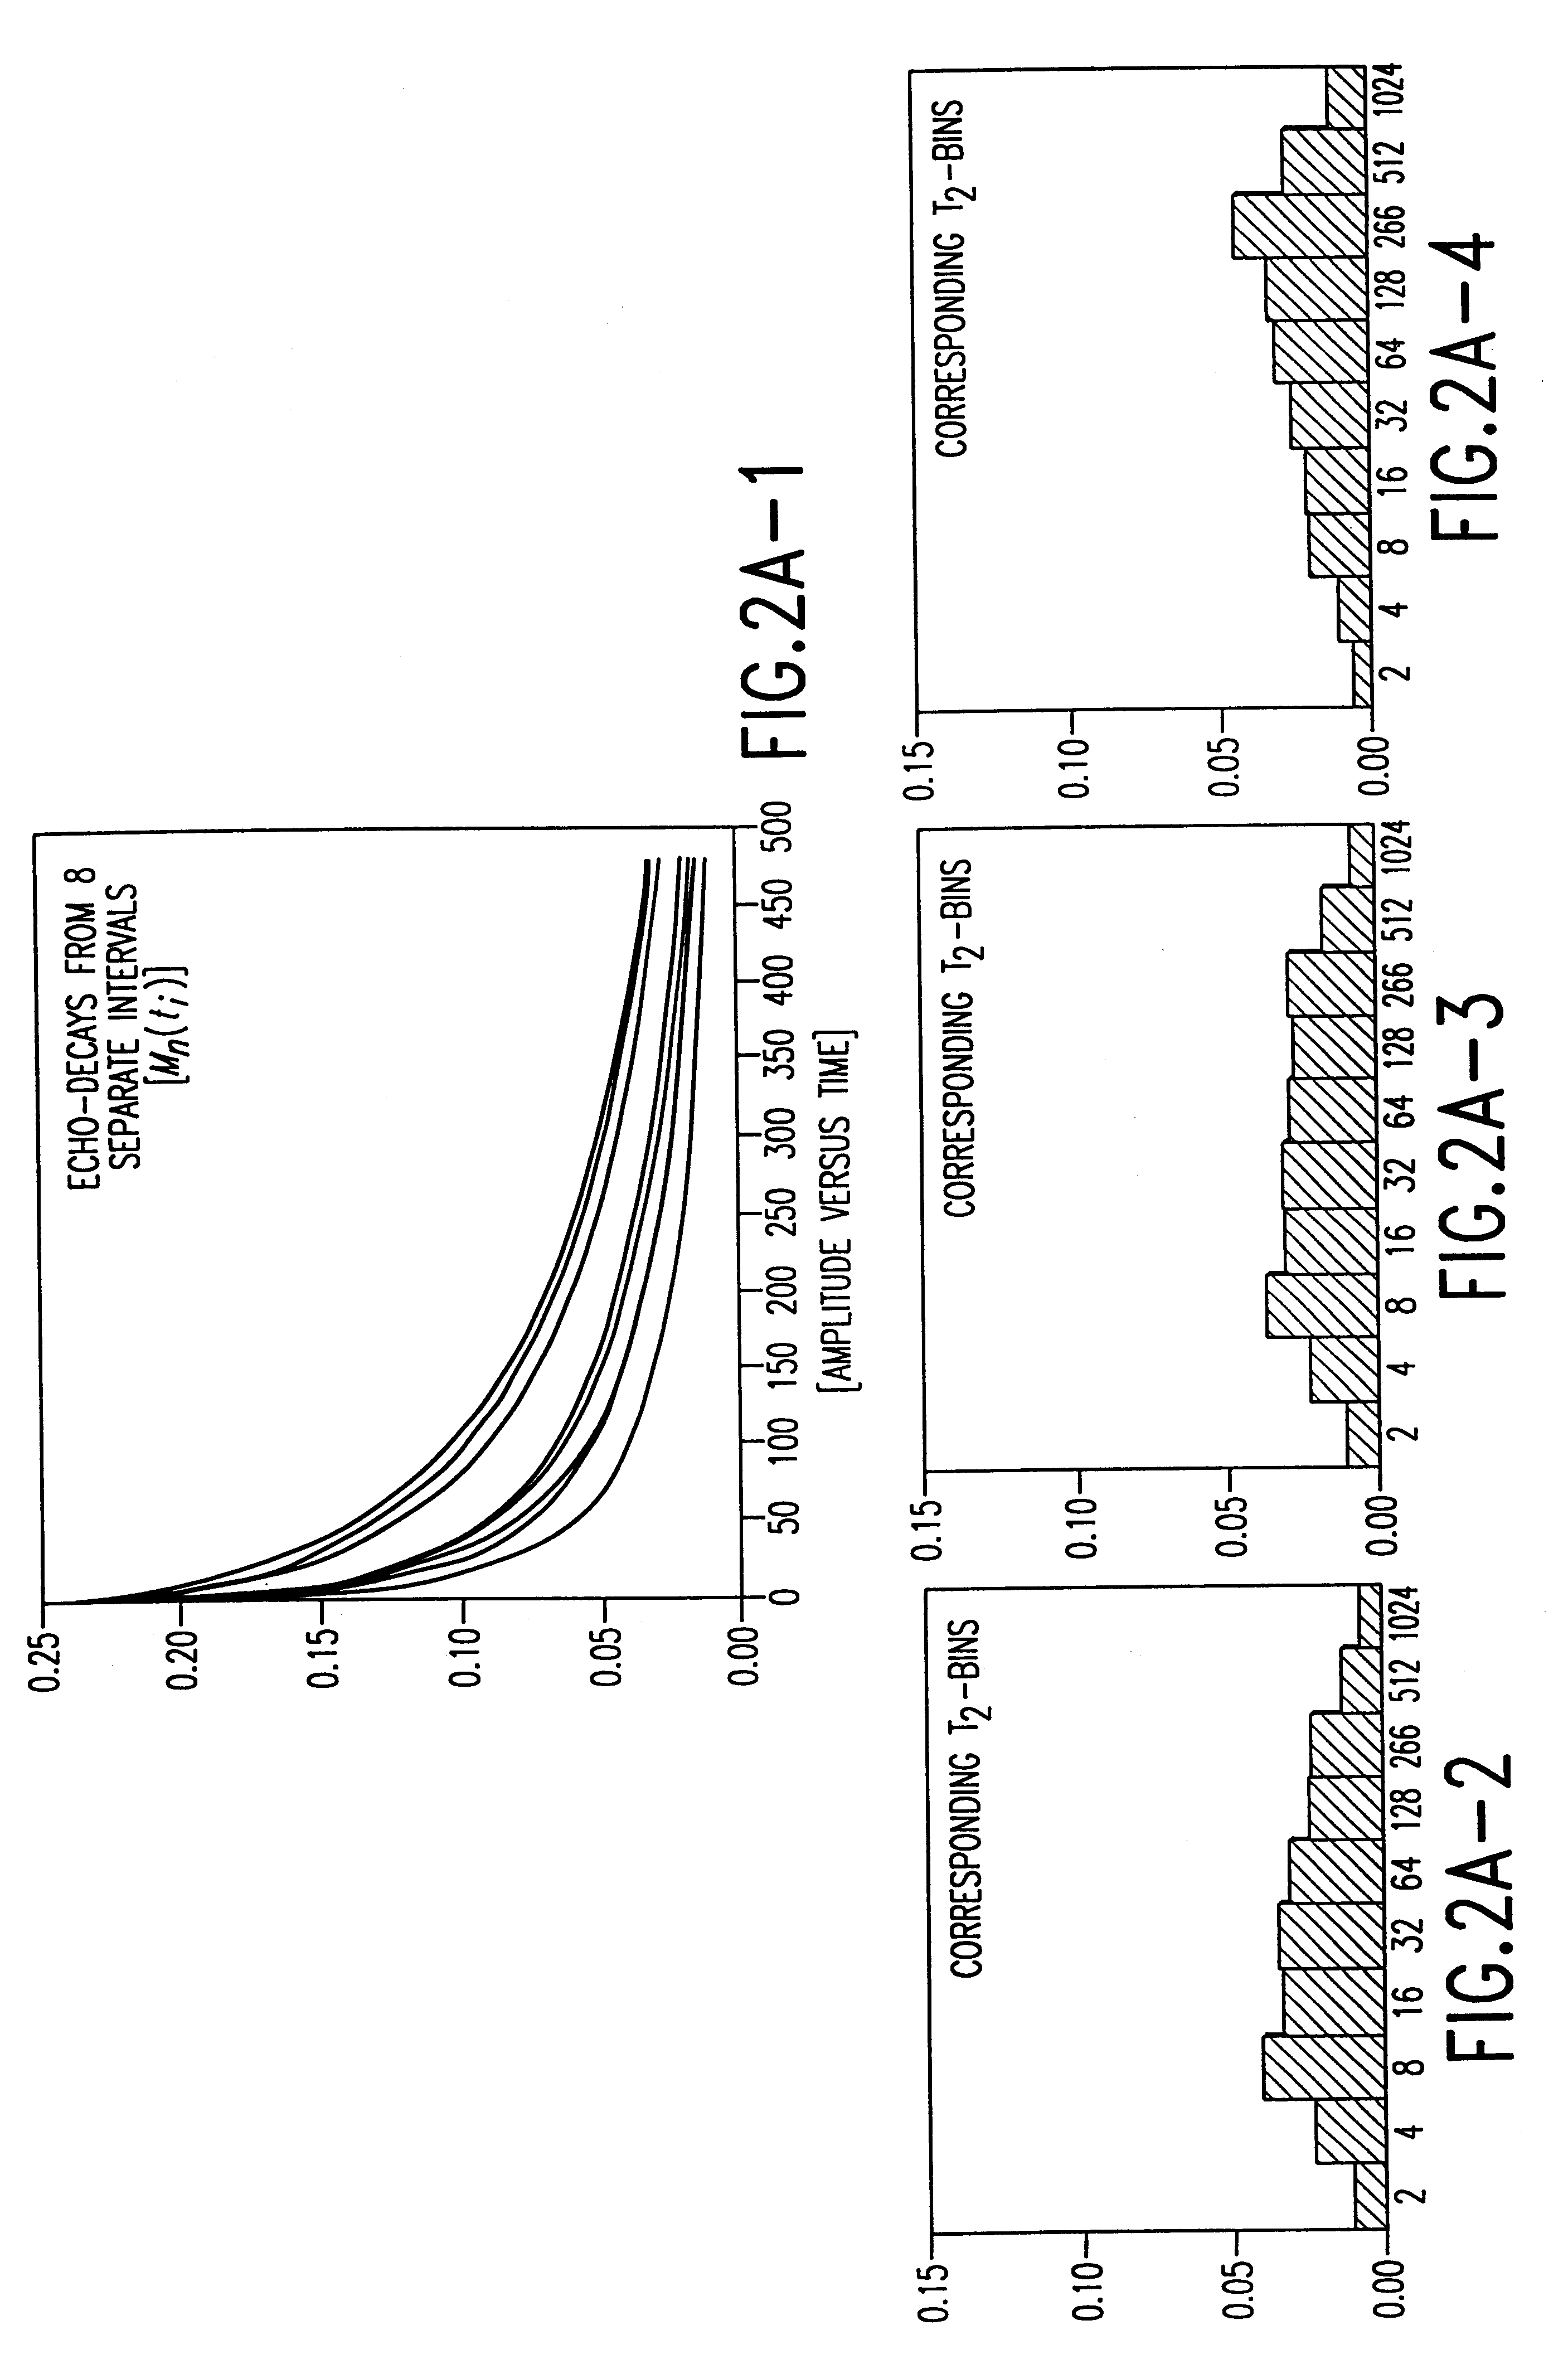
The litho-weight is derived from the EMI conductivity, as shown in FIG. 10D, where the weight is computed over 1 / 2-ft interval in the left and over 4-ft interval in the right. The GEVR processing resulted in two litho-echo trains for sand and silt laminae, which correspond to the following two distinctly different lithology-types in T.sub.2 -distrib...


PUM


Abstract

An interpretation method and system for NMR echo-train data in thinly laminated sequences. The invention uses geological information obtained at higher vertical resolution, such as using Electric Micro Imaging, to enhance the vertical resolution of echo-train data, and thus avoids log interpretations in which the hydrocarbon potential of the formation can be misread because low resolution logs tend to provide an average description of the formation. Such averaging is especially problematic in thinly laminated sequences that consist of highly permeable and porous sand layers and less permeable silt or essentially impermeable shale layers. In a preferred embodiment, using the additional high-resolution formation information one can estimate the typical T2-spectra of lithological laminae, and significantly enhance the permeability estimate in the laminated sequences. The method and system are applicable to any temporal data from other logging tools, such as the thermal neutron decay log and others. The system and method enable proper evaluation of the high potential of thinly laminated formations, which may otherwise be overlooked as low permeable formations.

Description

This invention generally relates to borehole logging and logging-while-drilling (LWD), and in particular to a system and method for determining the properties of layered geological formations. A specific embodiment relates to a system and method for determining layer composition using a high-resolution log, and deriving associated high-resolution formation layer properties using time-dependent data, such as nuclear magnetic resonance (NMR) logs.In oil and gas exploration it is always desirable to understand the structure and properties of the geological formation surrounding a borehole, in order to determine if the formation contains hydrocarbon resources (oil and / or gas), to estimate the amount and producibility of hydrocarbon contained in the formation, and to evaluate the best options for completing the well in production. A significant aid in this evaluation is the use of wireline logging and / or logging-while-drilling (LWD) measurements of the formation surrounding the borehole ...

Claims


Application Information

Patent Timeline
IPC IPC(8): G01V3/32G01R33/44G01V3/18G01R33/46
CPCG01N24/081G01V3/32G01R33/4625
Inventor DAY, PETER IANTUTUNJI, TAREK A.HAGIWARA, TERUHIKO
Owner HALLIBURTON ENERGY SERVICES INC
Why Eureka
Try Eureka