Spectral data classification of samples

a spectral data and sample technology, applied in the direction of optical radiation measurement, fluorescence/phosphorescence, instruments, etc., can solve the problems of difficult comparison, inability to reach a definitive conclusion, and inability to assign a condition to the spectra of many samples without significant ambiguity

Inactive Publication Date: 2002-07-16
LUMA IMAGING CORP
View PDF4 Cites 162 Cited by
  • Summary
  • Abstract
  • Description
  • Claims
  • Application Information

AI Technical Summary

Problems solved by technology

While such an analysis is straightforward in principle, it is often the case that a spectrum recorded from a test specimen does not match any known spectrum, or appears to have features present in more than one known spectrum.
In addition, there are often multiple features of interest or of consequence in a single spectrum, which makes any comparison problematic.
Thus, it is not always clear where a test sample should be placed with a range of known samples. the result is that the spectra of many samples cannot be assigned a condition by comparison to known samples without significant ambiguity.
In some instances, it is impossible to reach a definitive conclusion.

Method used


Image

  • Spectral data classification of samples
  • Spectral data classification of samples
  • Spectral data classification of samples

Examples


Embodiment Construction

The invention will be described in terms of embodiments that relate to the use of optical spectra to discriminate between known conditions, particularly in the area of medical diagnostics, and especially as it relates to the analysis of spectra obtained from human cervical tissue in the detection of cervical cancer. However, the invention has applicability generally in the area of using optical spectra to distinguish between two or more conditions.

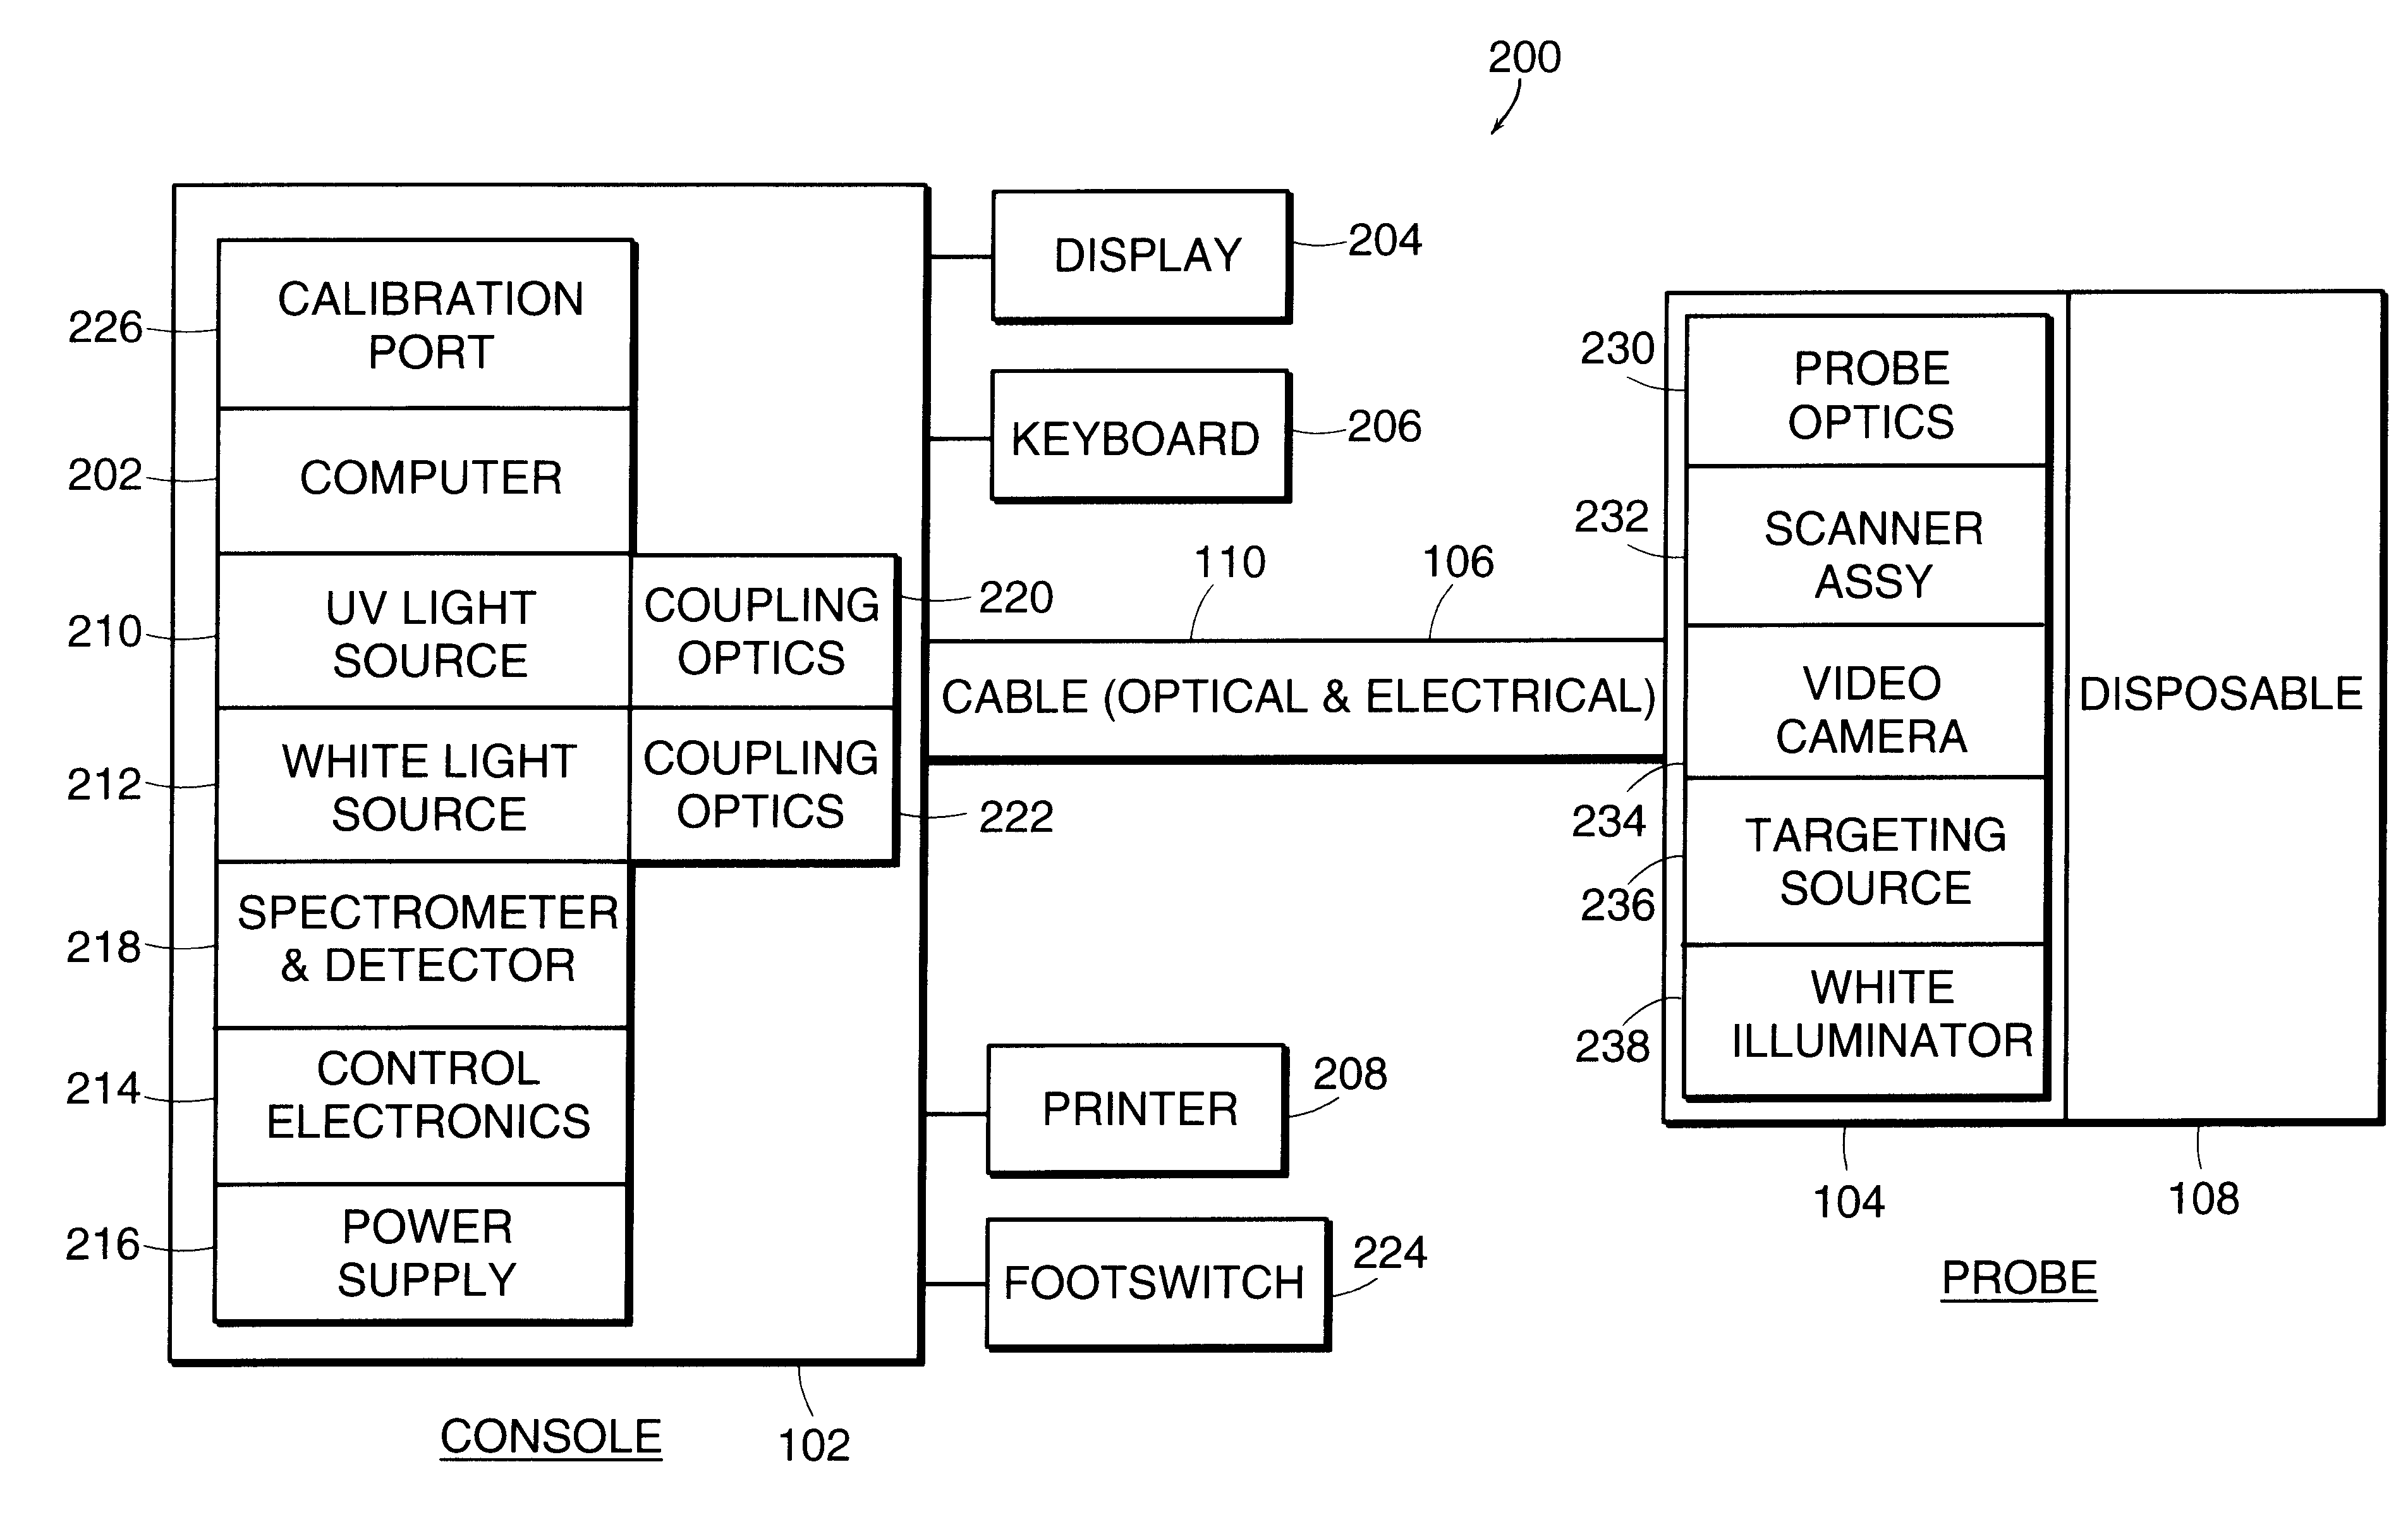
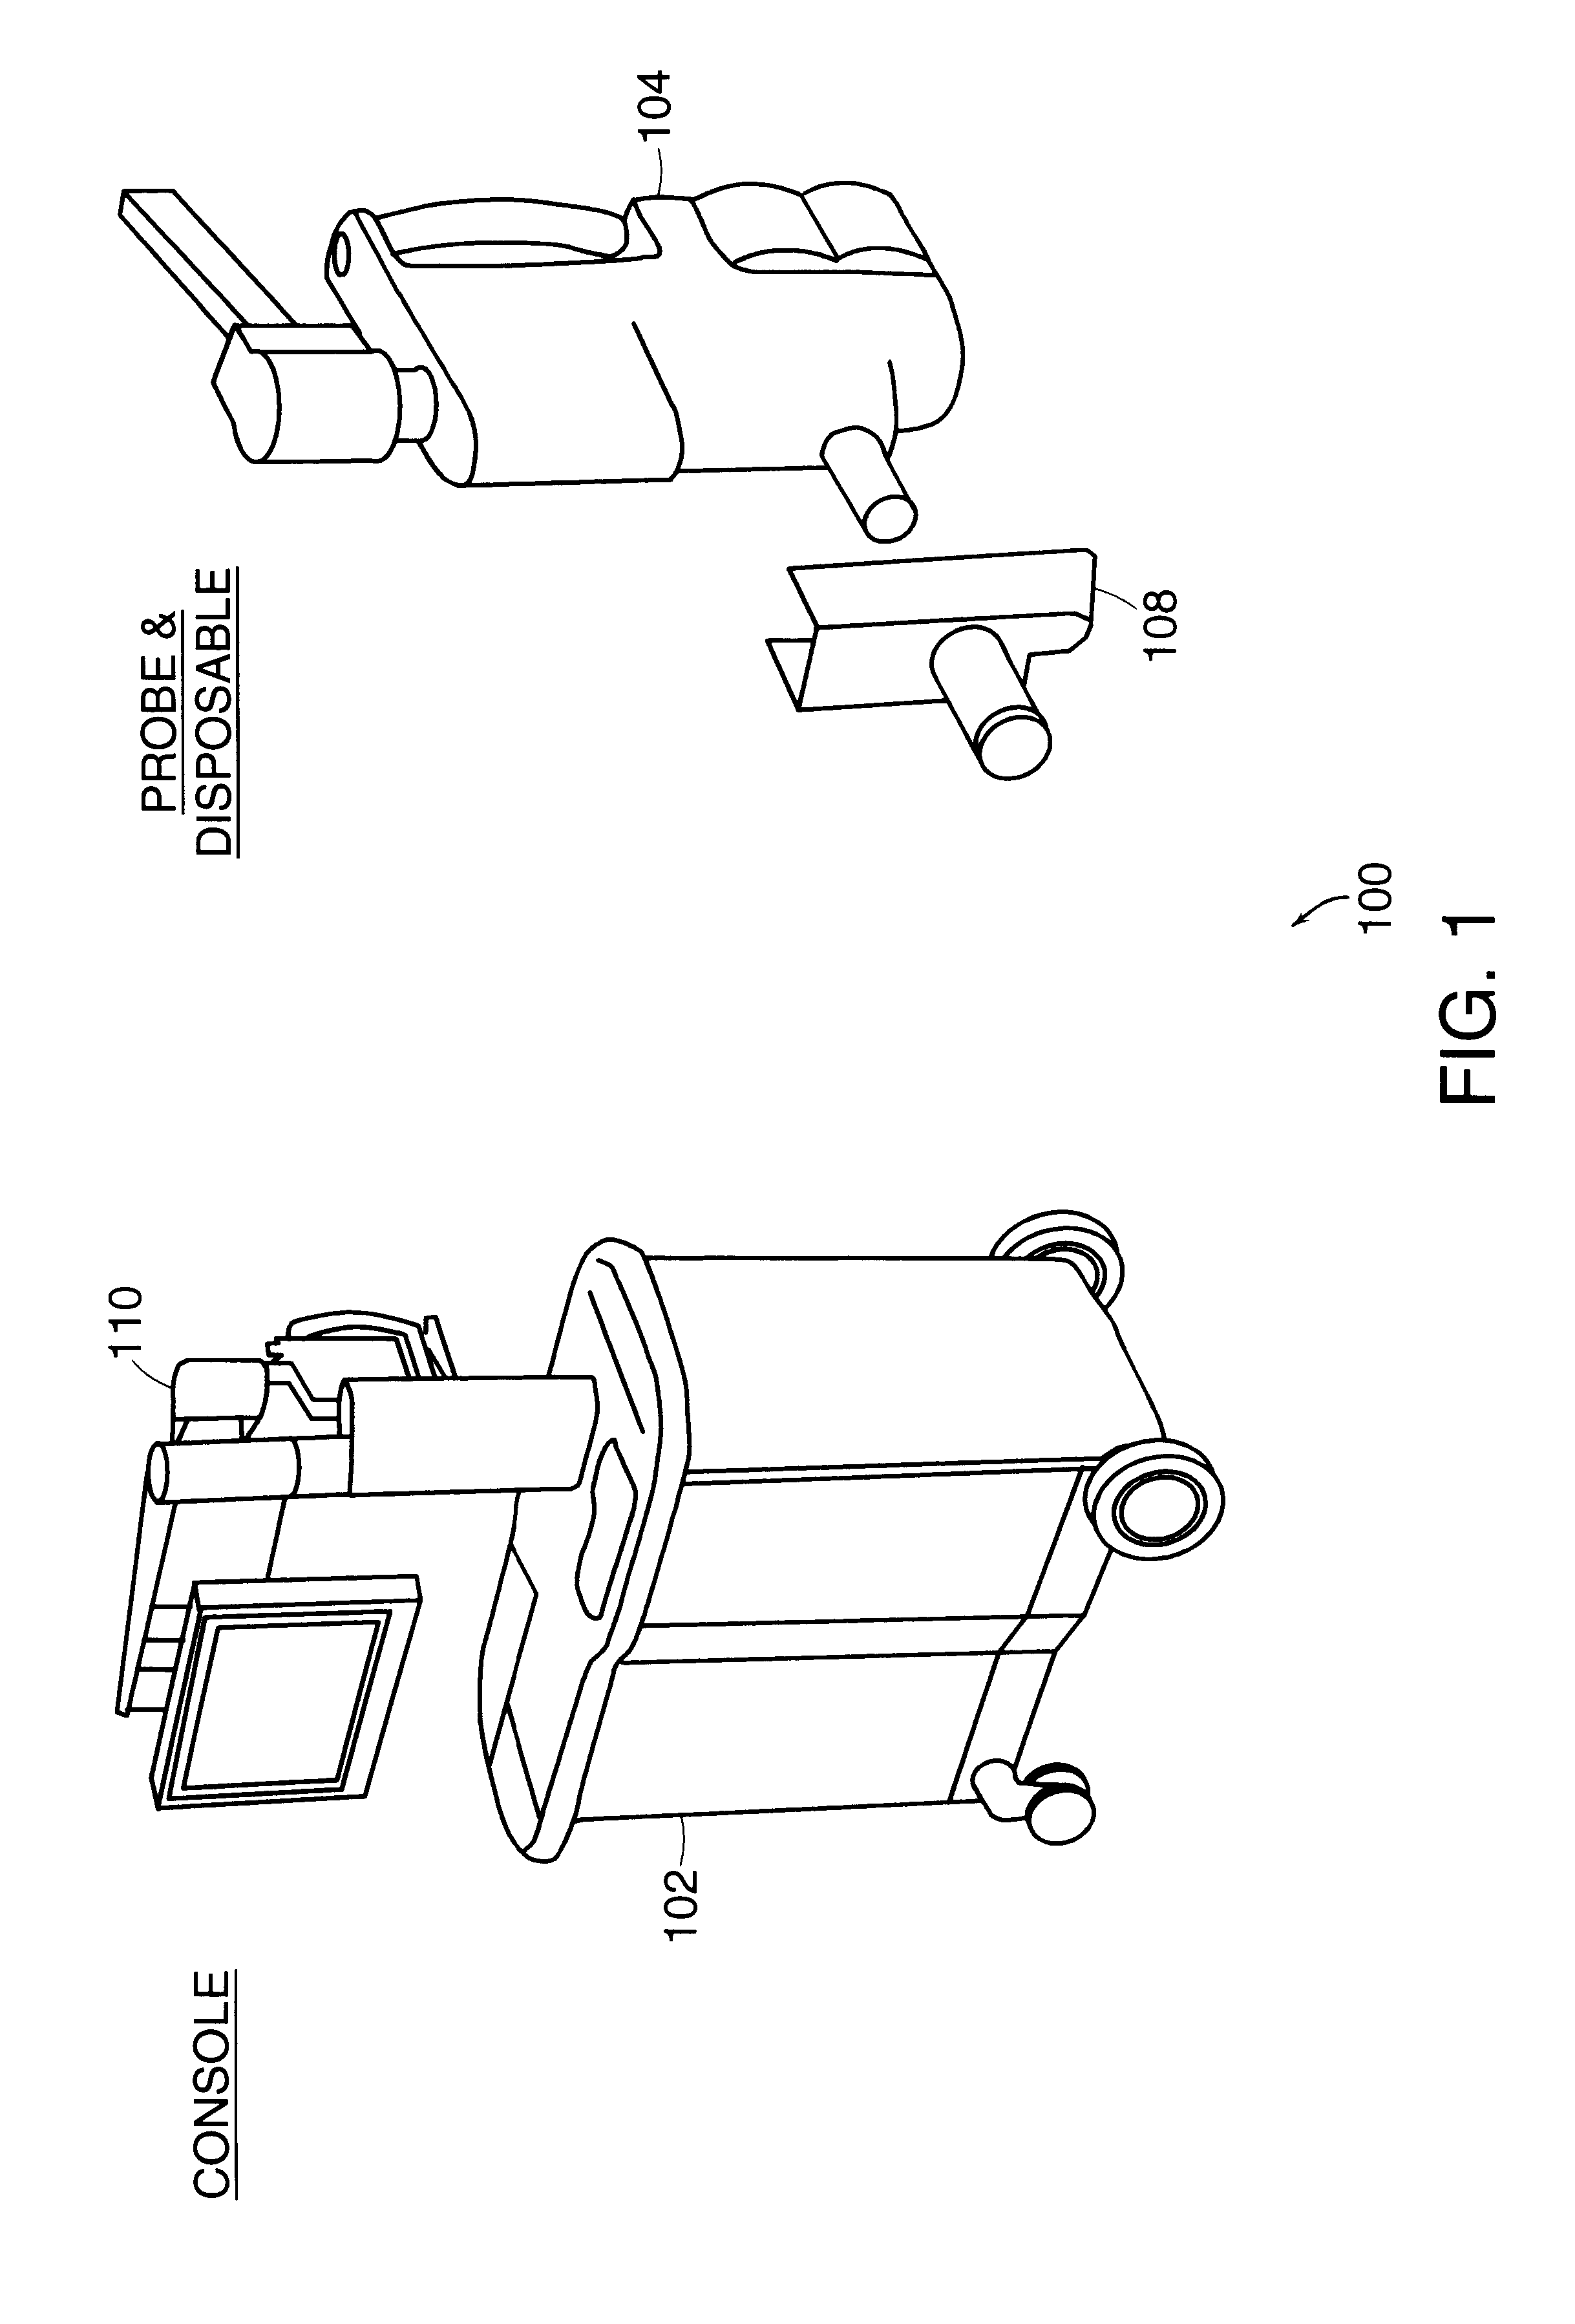
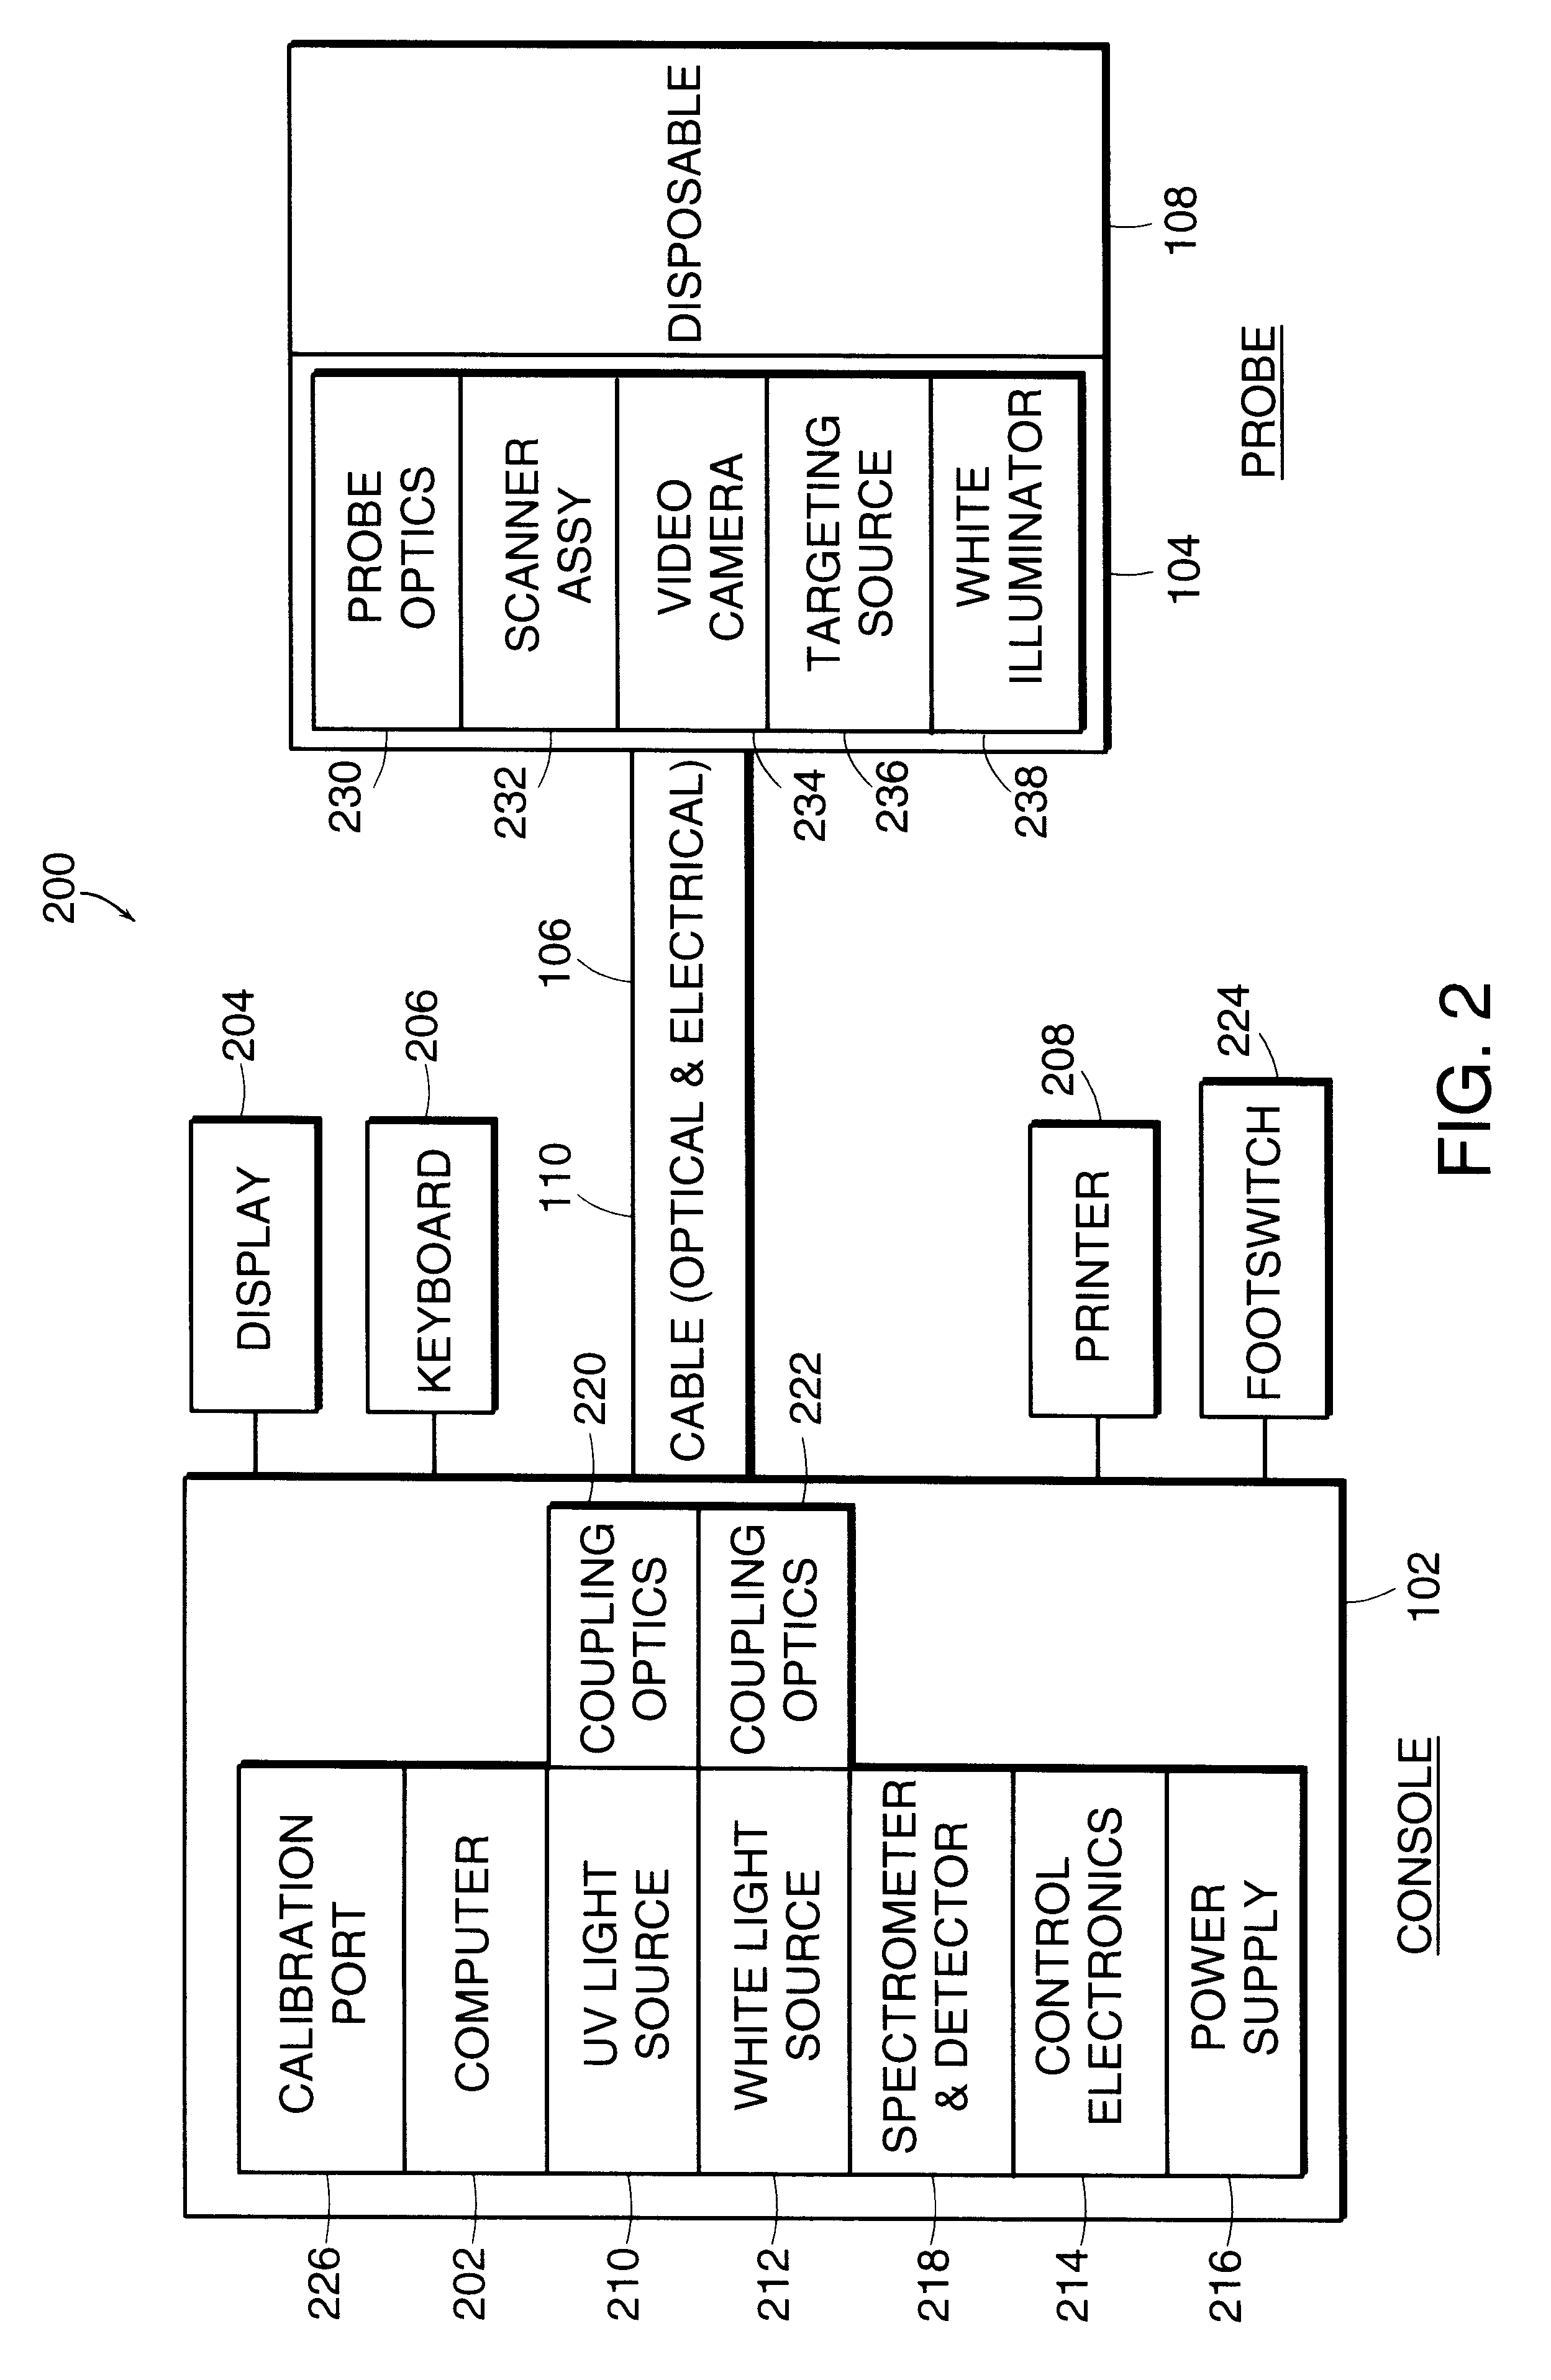
FIG. 1 depicts an exemplary spectroscopic system 100 employing a spectral data classification method according to an illustrative embodiment of the invention. The spectroscopic system comprises a console 102 connected to a probe 104 by a cable 106. The cable 106 carries electrical and optical signals between the console 102 and the probe 104. The probe 104 accommodates a disposable component 108 which used only once, and discarded after such use. The console 102 and the probe 104 are mechanically connected by cable 106. The console 102 con...


PUM

PropertyMeasurementUnit
lengthaaaaaaaaaa
wavelengthaaaaaaaaaa
wavelengthsaaaaaaaaaa

Abstract

A system and method for classifying tissue by application of discriminant analysis to spectral data. Spectra are recorded as amplitudes at a series of discrete wavelengths. Pluralities of reference spectra are recorded for specimens having known conditions. The reference spectra are subjected to discriminant analysis to determine wavelength regions of interest for the analysis. A plurality of amplitudes are selected for the analysis, and are plotted in an N-dimensional space. For each plurality of reference spectra corresponding to a specific known condition, a characteristic point is determined and plotted, the characteristic point representative of the known condition. A test spectrum is recorded from a test specimen, and the plurality of amplitudes corresponding in wavelength to the wavelength regions of interest are selected. A characteristic point in N-dimensional space is determined for the test spectrum. The distance of the characteristic point of the test spectrum from each of the plurality of characteristic points representative of known conditions is determined. The test specimen is assigned the condition corresponding to the characteristic point of a plurality of reference spectra, based on a distance relationship with at least two distances, provided that at least one distance is less than a pre-determined maximum distance. In some embodiments, the test specimen can comprise human cervical tissue, and the known conditions can include normal health, metaplasia, CIN I and CIN II / III.

Description

This invention relates generally to the use of spectral data for categorizing materials. More particularly, the invention relates to the use of spectral data for classifying tissue by discriminant analysis.1. Field of the InventionThis invention relates generally to the use of spectral data for categorizing materials. More particularly, the invention relates to the use of spectral data for classifying tissue by discriminant analysis.2. Background of the InventionInformation obtained from spectral analysis is useful in such diverse fields as geology, chemistry, medicine, physics and biology. For example, it is known that cells and tissues emit characteristic spectra in response to light stimulation. The nature of those spectra is indicative of the health of the tissue. Thus, a cancerous tissue has associated with it an emission spectrum that is different than the emission spectrum of a corresponding healthy tissue. Similarly, emission spectra are used in attempts to differentiate bet...

Claims


Application Information

Patent Timeline
Patent Type & Authority Patents(United States)
IPC IPC(8): A61B6/00A61B1/04G01N21/64A61B5/00A61B10/00G01NG01N21/17G01N21/27G01N21/33G01N21/47
CPCA61B5/0059A61B5/0068
Inventor COSTA, PETER J.HUI, KWONGNORDSTROM, ROBERT J.
Owner LUMA IMAGING CORP
Why Eureka
Try Eureka