Method and apparatus for geographic shape preservation for identification

a technology of geographic shape and identification method, applied in image enhancement, navigation instruments, instruments, etc., can solve the problems of loss or under-highlighting of other data variables, difficult presentation of very small regions and data associated with those small regions, and difficulty in presenting small regions and data, so as to enhance the analyst's view of data, enhance the understanding of displayed data, and increase the space available for display

Inactive Publication Date: 2005-01-25
HRL LAB
View PDF20 Cites 36 Cited by
  • Summary
  • Abstract
  • Description
  • Claims
  • Application Information

AI Technical Summary

Benefits of technology

These objects and others are provided by preferred embodiments of methods according to the present invention. The present invention provides that geospatial data is displayed based upon the automatic segmentation of map-based imagery by political and / or geographic boundaries. Each segment may then be scaled based on the information density within that segment. The segments are positioned to retain the shapes of the original imagery as much as possible. This unique form of distortion enhancement increases the space available for display of overlaid data, while preserving salient features, such as shape, context, and relative positions.
The present method provides that the geographic shapes of geographic entities are retained as much as possible, even though map displays are being transformed based on overlay data. Transformations according to the present invention enhance the understanding of the displayed data. Therefore, the present invention provides that the geospatial objects and data are the important features of the display, rather than the underlying maps. The specialized distortions used in the map transformations according to the present invention enhance an analyst's view of the data. The nonlinear magnification provides increased detail in areas with high information density, making it easier to correlate data at many scales. The segmentation of the maps according to the overlay data allows for distant data to be brought together for easy comparison. Thus, the present invention provides for a common operating picture for scale-dependent data and spatial comparison over large distances to provide decision makers the ability to make fast preliminary analyses.
One preferred embodiment of the present invention provides a method for enhancing the display of geospatially-based data on a map, wherein said geospatially-based data is associated with map-based entities, and the method comprises the steps of: specifying a hierarchy for the map-based entities shown on a map; segmenting the map into logical segments based on the hierarchy of map-based entities; associating the geospatially-based data with corresponding logical segments; calculating a corresponding scale factor for each logical segment; scaling each logical segment according to the corresponding scale factor; repositioning each logical segment to minimize intersections between each logical segment and any other logical segment; and displaying a map of the scaled and repositioned logical segments. Preferably, the logical segments comprise areas of pixels and the geospatially-based data is registered to pixels within the areas of pixels.

Problems solved by technology

However, in representing data on a standard map, misperceptions can arise, because visualizing data on a standard map inherently emphasizes regions with the greatest geographic area, while making the presentation of very small regions and the data associated with those small regions quite difficult.
A further limitation with both types of cartograms is that the scaling of the geographic or political units is normally based on a single data variable.
Hence, the representation of other data variables may be lost or underemphasized due to the cartogram scaling used for the first variable.
Display of the data at a resolution that will allow the entire geographic area to be seen may result in the information display in informationally dense areas to be unreadable.
However, these methods may hide the geographic relationship between the areas in which the data is displayed.

Method used


Image

  • Method and apparatus for geographic shape preservation for identification
  • Method and apparatus for geographic shape preservation for identification
  • Method and apparatus for geographic shape preservation for identification

Examples


Embodiment Construction

Traditionally, cartographers produce maps by projecting the polar coordinates of the Earth into a two or three-dimensional Cartesian representation, as indicated by the equation below:

GeographicData→Projection(σ,ω,r)→map(x,y)

These projections are static and have few constraining factors that affect the resultant map. A common constraining factor is a minimum and maximum latitude and longitude that has the effect of limiting the region represented in the map to a country, state, or city. There is always a scale applied to the projection, making it a manageable size, such as 1:125000 or 1:500000.

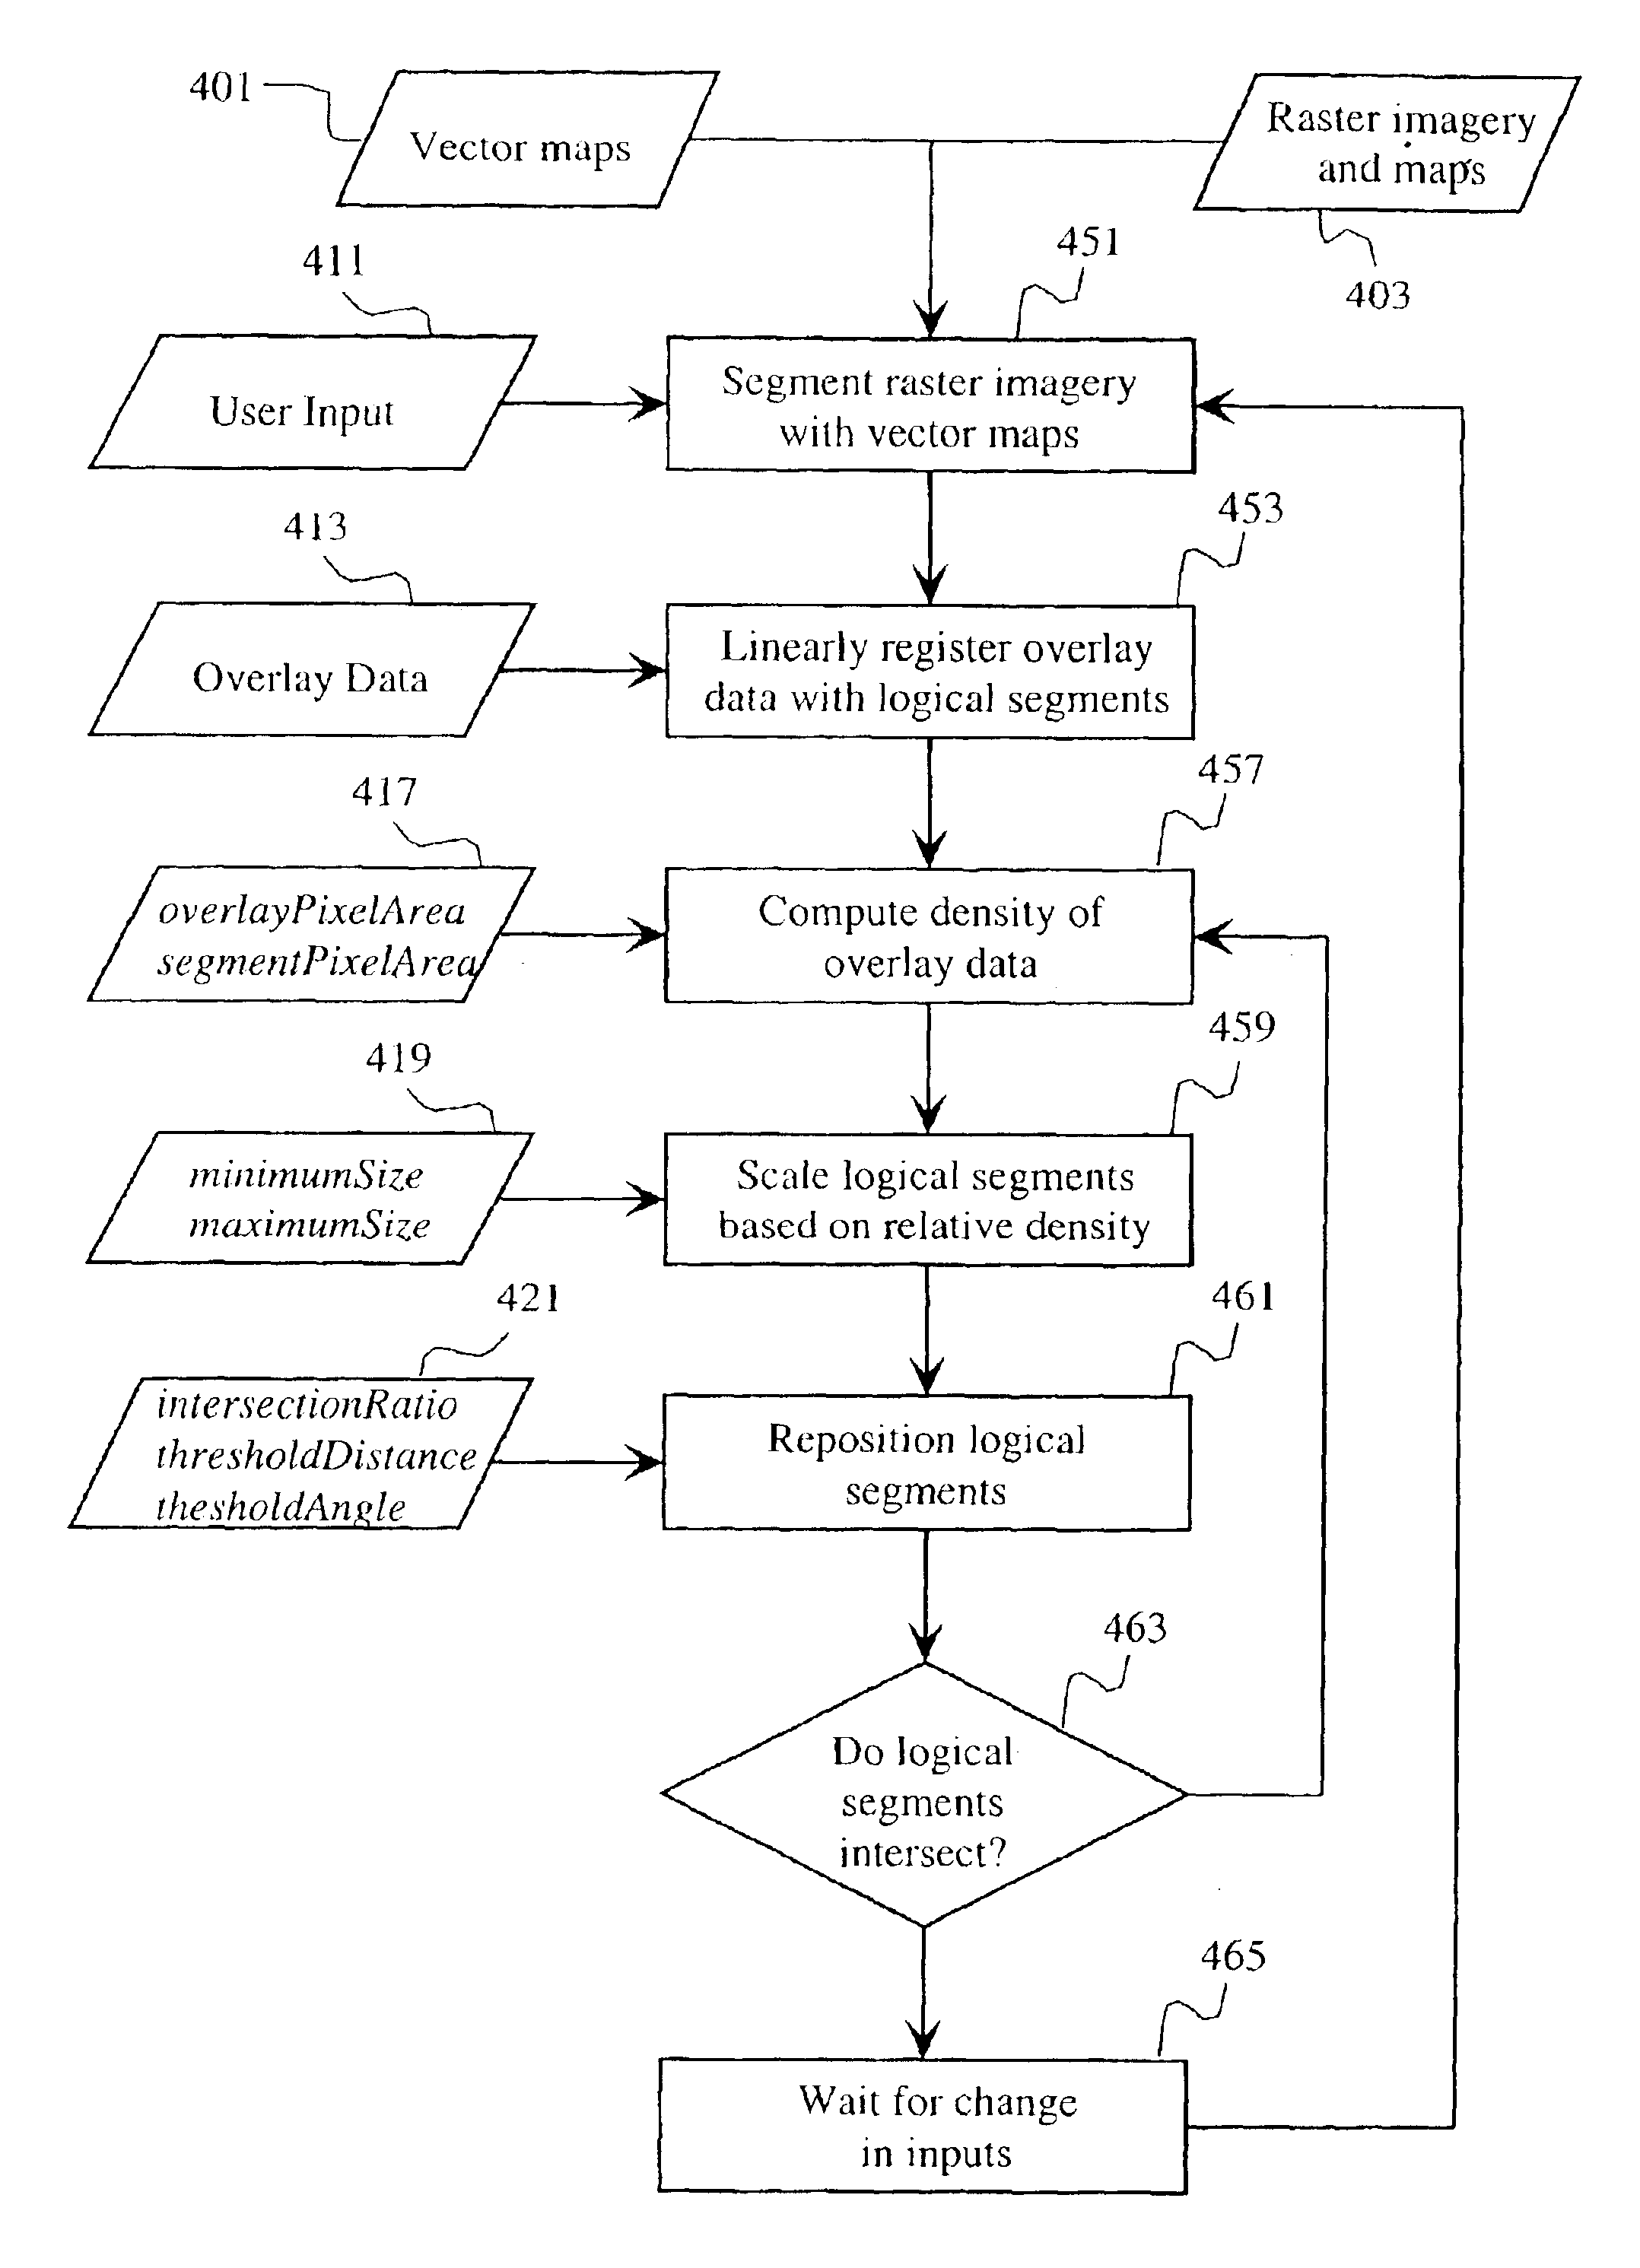
Embodiments of the present invention introduce a supplemental transformation to the projection described above. The new transformation incorporates additional factors into the generation of a map, such as information density within bounded regions of the map. This enables regions to be transformed independent of each other. The transformation used by embodiments of the present invention may be...


PUM


Abstract

A method for transforming a map based on associated geospatial data. A map is segmented into logical segments representing map-based entities. The geospatial data is then associated with the logical segments. The logical segments are scaled based upon the associated data. The logical segments are then repositioned to avoid overlapping other logical segments and a new map display based on the scaled and repositioned logical segments is provided.

Description

BACKGROUND1. FieldThe present invention relates to representation of geospatially-based data and, more specifically, enhancement of the representation of such data to improve the understanding of such data.2. Discussion of Related ArtA geographic information system is an information system designed to associate data of various types with spatial or geographic coordinates. Typically, a geographic information system displays data overlaid on some type of map showing geographic or political boundaries. Hence, the geographic information system is slaved to an underlying map. Data are registered to geographic positions on various projections of the earth, such as Mercator, Hammer, Gnomic, or Eumorphic. However, in representing data on a standard map, misperceptions can arise, because visualizing data on a standard map inherently emphasizes regions with the greatest geographic area, while making the presentation of very small regions and the data associated with those small regions quite ...

Claims


Application Information

Patent Timeline
Patent Type & Authority Patents(United States)
IPC IPC(8): G01C21/32G01C21/28G06F17/00G06T17/50G06F17/30G06T3/00G06T5/00G06T11/00G06T17/05
CPCG06T3/40G06T11/00G06T7/0083G06T7/12
Inventor FOX, JASONDAILY, MICHAEL J.
Owner HRL LAB
Why Eureka
Try Eureka