Image metrics in the statistical analysis of DNA microarray data

a statistical analysis and image technology, applied in the field of dna microarray analysis, can solve the problem of relatively little attention to the computation required to obtain accurate intensity information from microarrays

Inactive Publication Date: 2005-03-01
GLOBAL LIFE SCI SOLUTIONS USA LLC
View PDF10 Cites 4 Cited by
  • Summary
  • Abstract
  • Description
  • Claims
  • Application Information

AI Technical Summary

Problems solved by technology

However, relatively little attention has been paid to the computation required to obtain accurate intensity information from microarrays.
The issue is important however, because microarray signals are weak and biologically interesting results are usually obtained through the analysis of outliers.

Method used


Image

  • Image metrics in the statistical analysis of DNA microarray data
  • Image metrics in the statistical analysis of DNA microarray data
  • Image metrics in the statistical analysis of DNA microarray data

Examples


Embodiment Construction

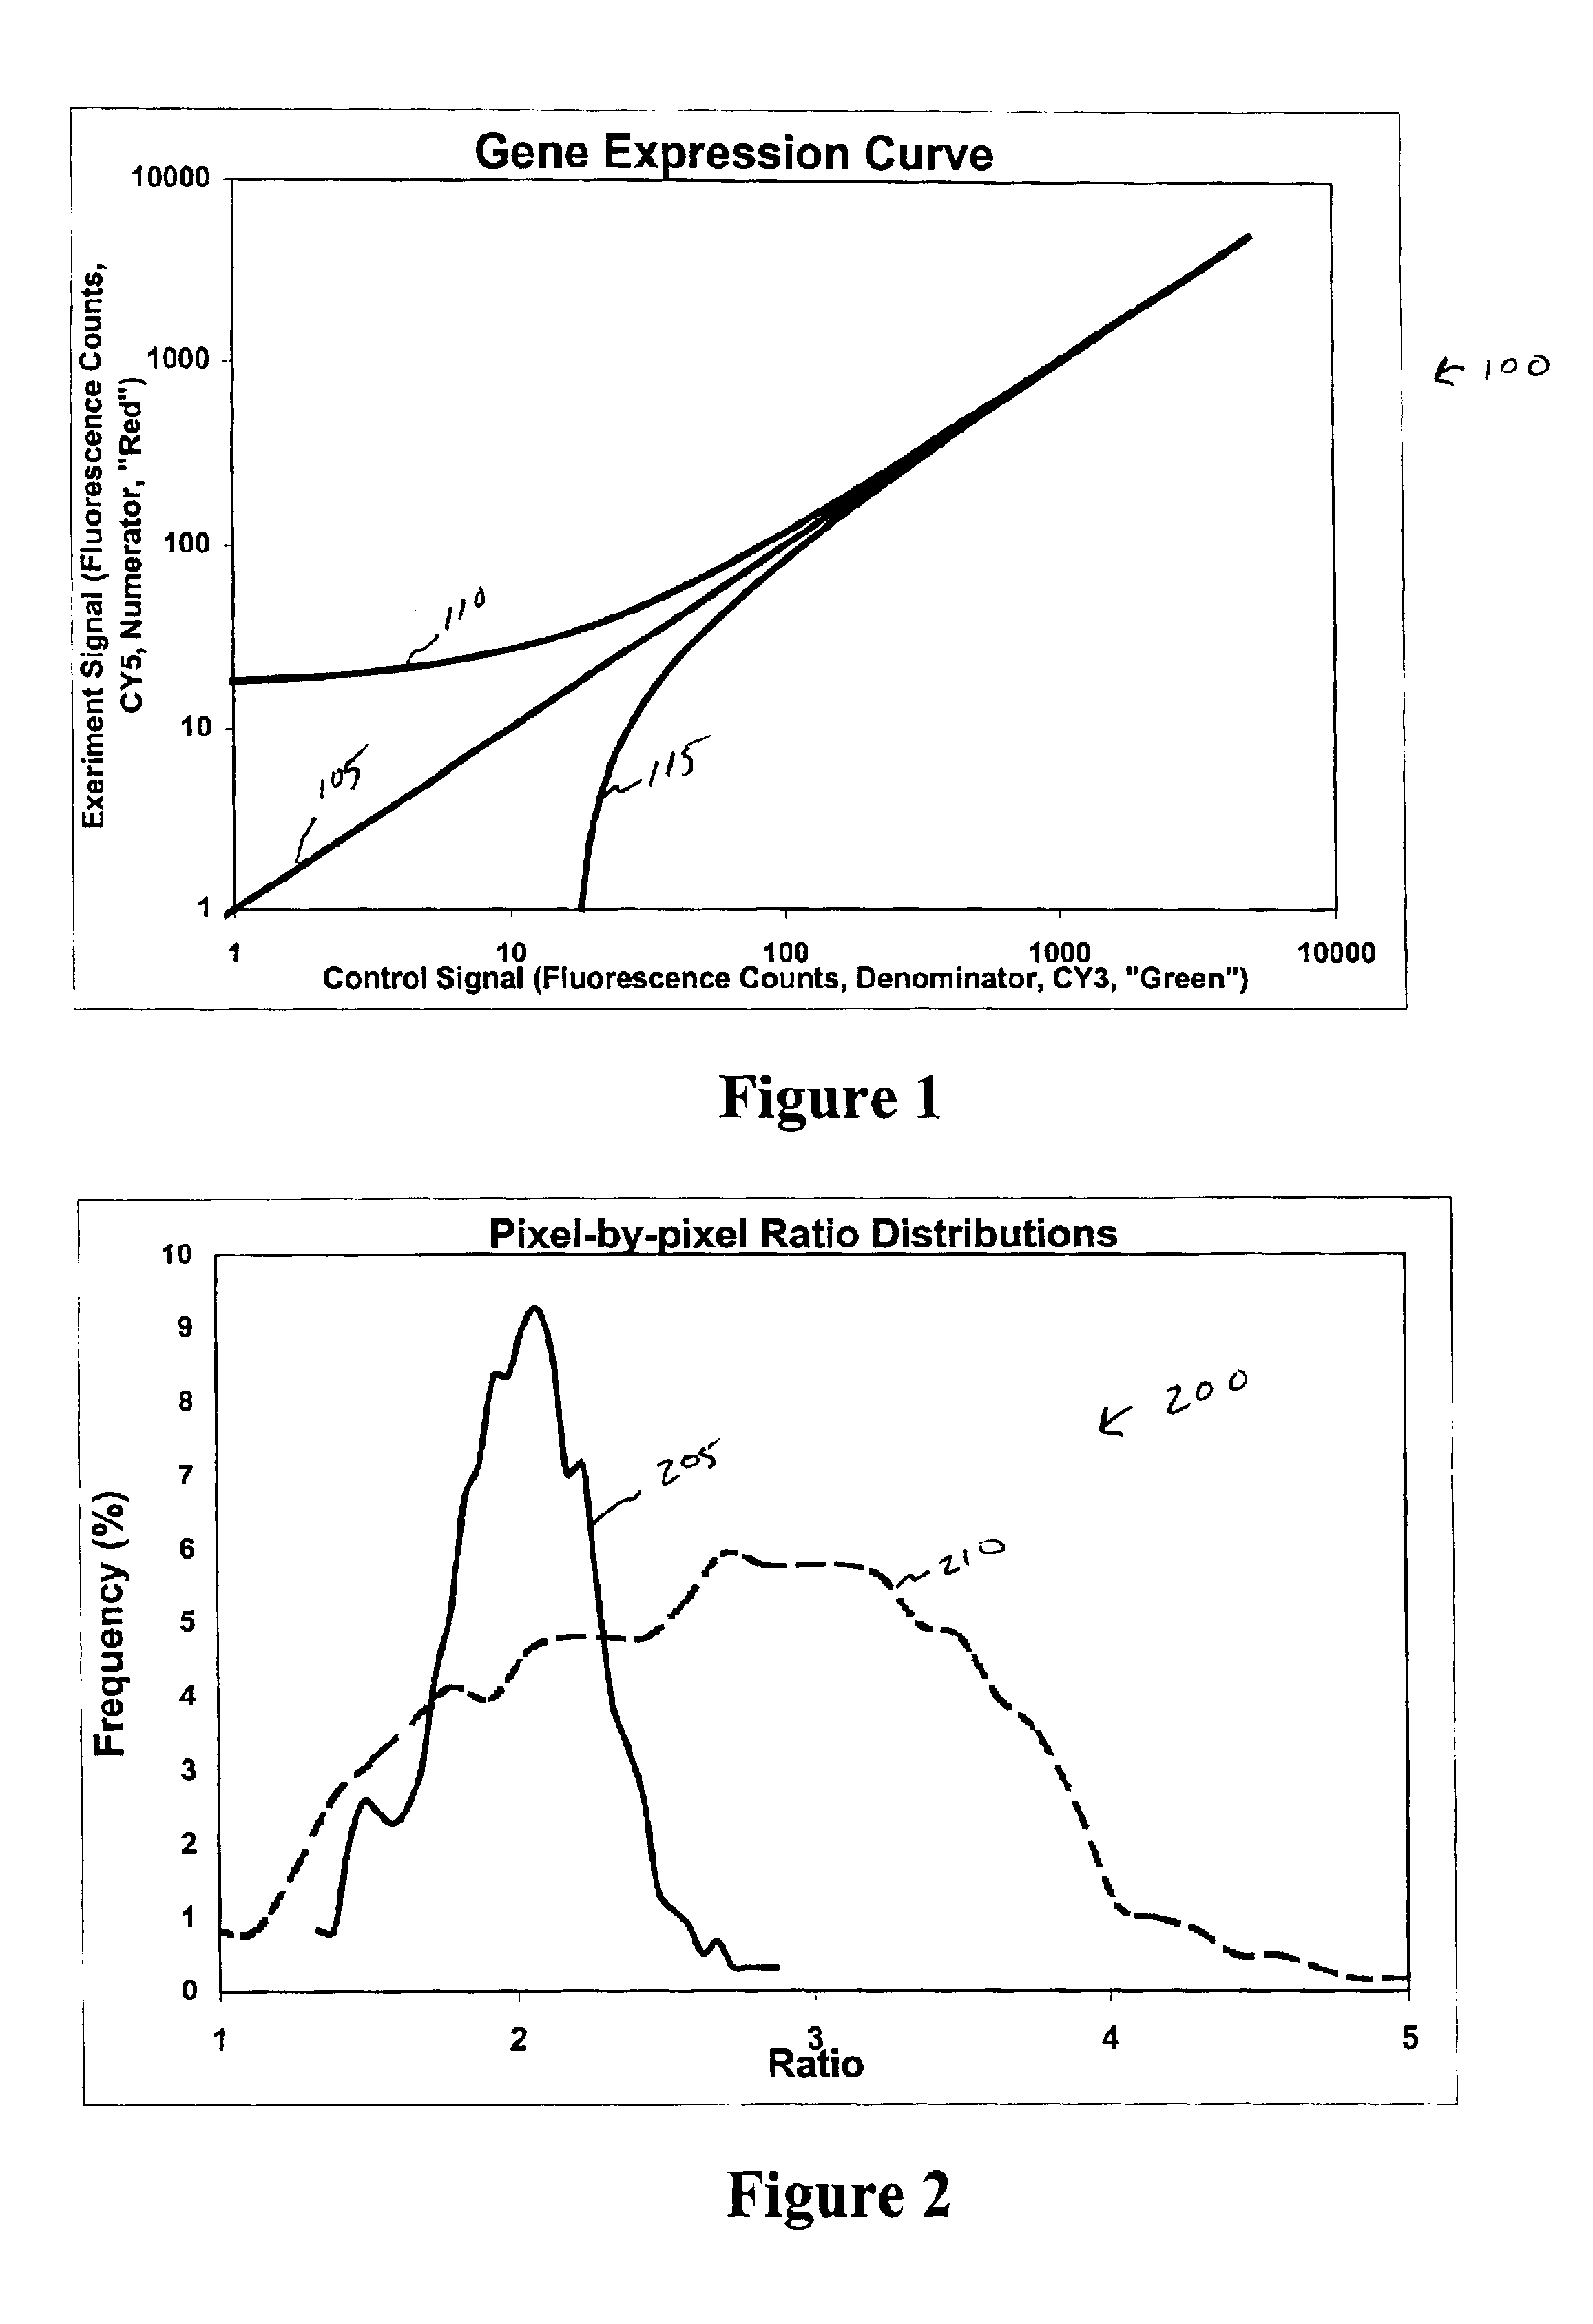
The present invention involves the process of extracting quantitatively accurate ratios from pairs of images and the process of determining the confidence at which the ratios were properly, obtained. One common application of this methodology is analyzing cDNA Expression Arrays (microarrays). In these experiments, different cDNA's are arrayed onto a substrate and that array of probes is used to test biological samples for the presence of specific species of mRNA messages through hybridization. In the most common implementation, both an experimental sample and a control sample are hybridized simultaneously onto the same probe array. In this way, the biochemical process is controlled for throughout the experiment. The ratio of the experimental hybridization to the control hybridization becomes a strong predictor of induction or repression of gene expression within the biological sample.

The gene expression ratio model is essentially, Expression_Ratio=Experiment_ExpressionWild⁢-⁢type_Ex...


PUM

PropertyMeasurementUnit
center-to-center distanceaaaaaaaaaa
areaaaaaaaaaaa
CVaaaaaaaaaa

Abstract

Expression profiling using DNA microarrays is an important new method for analyzing cellular physiology. In “spotted” microarrays, fluorescently labeled cDNA from experimental and control cells is hybridized to arrayed target DNA and the arrays imaged at two or more wavelengths. Statistical analysis is performed on microarray images and show that non-additive background, high intensity fluctuations across spots, and fabrication artifacts interfere with the accurate determination of intensity information. The probability density distributions generated by pixel-by-pixel analysis of images can be used to measure the precision with which spot intensities are determined. Simple weighting schemes based on these probability distributions are effective in improving significantly the quality of microarray data as it accumulates in a multi-experiment database. Error estimates from image-based metrics should be one component in an explicitly probabilistic scheme for the analysis of DNA microarray data.

Description

TECHNICAL FIELDThis invention relates to DNA microarray analysis, and more particularly to using error estimates from image based metrics to analyze microarrays.BACKGROUNDLarge-scale expression profiling has emerged as a leading technology in the systematic analysis of cell physiology. Expression profiling involves the hybridization of fluorescently labeled cDNA, prepared from cellular mRNA, to microarrays carrying up to 105 unique sequences. Several types of microarrays have been developed, but microarrays printed using pin transfer are among the most popular. Typically, a set of target DNA samples representing different genes are prepared by PCR and transferred to a coated slide to form a 2-D array of spots with a center-to-center distance (pitch) of about 200 μm. In the budding yeast S. cerevisiae, for example, an array carrying about 6200 genes provides a pan-genomic profile in an area of 3 cm2 or less. mRNA samples from experimental and control cells are copied into cDNA and la...

Claims


Application Information

Patent Timeline
Patent Type & Authority Patents(United States)
IPC IPC(8): G06T7/00G06T7/40G01N33/53G01N37/00
CPCG06K9/00G06T7/401G06T7/0012G06T2207/30072G06T7/41G06F18/00
Inventor BROWN, CARL S.GOODWIN, PAUL C.
Owner GLOBAL LIFE SCI SOLUTIONS USA LLC
Why Eureka
Try Eureka