Simultaneous measurement and display of 3-D size distributions of particulate materials in suspensions

a technology of particle size distribution and suspension, which is applied in the direction of measurement arrangements for variables, instruments, image data processing, etc., can solve the problems of affecting the accuracy of measurement results

Inactive Publication Date: 2005-03-29
COULTER INTERNATIONAL CORPORATION
View PDF13 Cites 44 Cited by
  • Summary
  • Abstract
  • Description
  • Claims
  • Application Information

AI Technical Summary

Benefits of technology

According to one aspect of the present invention, an apparatus for analyzing particles suspended in a fluid medium is provided. The apparatus includes an image detector for obtaining at least one still image of a plurality of particles suspended in the fluid medium and an image analyzing unit for measuring a set of at least two dimensional characteristics per particle for particles appearing in the still image and for comparing the measured sets of dimensional characteristics to determine an occurrence characteristic of particles having a matching set of dimensional characteristics. In addition, the apparatus includes a display unit that presents a representation of the above referenced characteristics in a manner enabling an intended entity to determine the shape distribution of particles appearing in the still image, or images. Preferably, the representation is a three dimensional (3-D) representation providing information about the particles in a manner which permits a viewer to readily determine a shape and size distribution of the particles.
According to another aspect of the present invention, a method of analyzing particles suspended in a fluid medium is provided. The method includes the steps of obtaining a still image of a plurality of particles suspended in a fluid medium, measuring at least two dimensional characteristics per particle for particles appearing in the image, and comparing the measured dimensional characteristics to determine an occurrence characteristic of particles having given dimensional characteristics. In addition, the method includes the step of displaying a three dimensional representation of the characteristics. The three dimensional representation has three coordinates with a pair of the coordinates corresponding to the particle dimensional characteristics and a third coordinate corresponding to the occurrence characteristic. The three dimensional representation provides information on the particles in a manner which permits a viewer of the display to determine a shape distribution of the particles appearing in the image.

Problems solved by technology

In such a technology, the determination of more than one parameter is difficult and generally cannot be accomplished, and size is typically represented as a single parameter, such as, a mean value or a distribution.
Thus, any deviation of particle shape from that of a sphere produces errors or bias in the results of the particle size determination.
Most conventional techniques produce unsatisfactory results when analyzing the size distribution of particles that are non-spherical, particularly when at least some of the particles have extreme shapes such as rod-like or plate-like shapes.
Thus, the determined size distribution often does not accurately reflect the actual size distribution of particles within a given sample of a suspension, and with respect to quality control issues, such techniques are not sufficiently sensitive to detect changes in the sizes and shapes of particles that may exist from one sample to the next.
Further, a single size parameter utilized to represent sizes of particles in a sample clearly no longer meets the needs of current particle research, development, production and quality control.
However, the required particle orientation, sample preparation, time consumption, and expense of conventional microscopic technologies limit their application in daily research and development and quality control operations.

Method used


Image

  • Simultaneous measurement and display of 3-D size distributions of particulate materials in suspensions
  • Simultaneous measurement and display of 3-D size distributions of particulate materials in suspensions
  • Simultaneous measurement and display of 3-D size distributions of particulate materials in suspensions

Examples


example no.1

EXAMPLE NO. 1

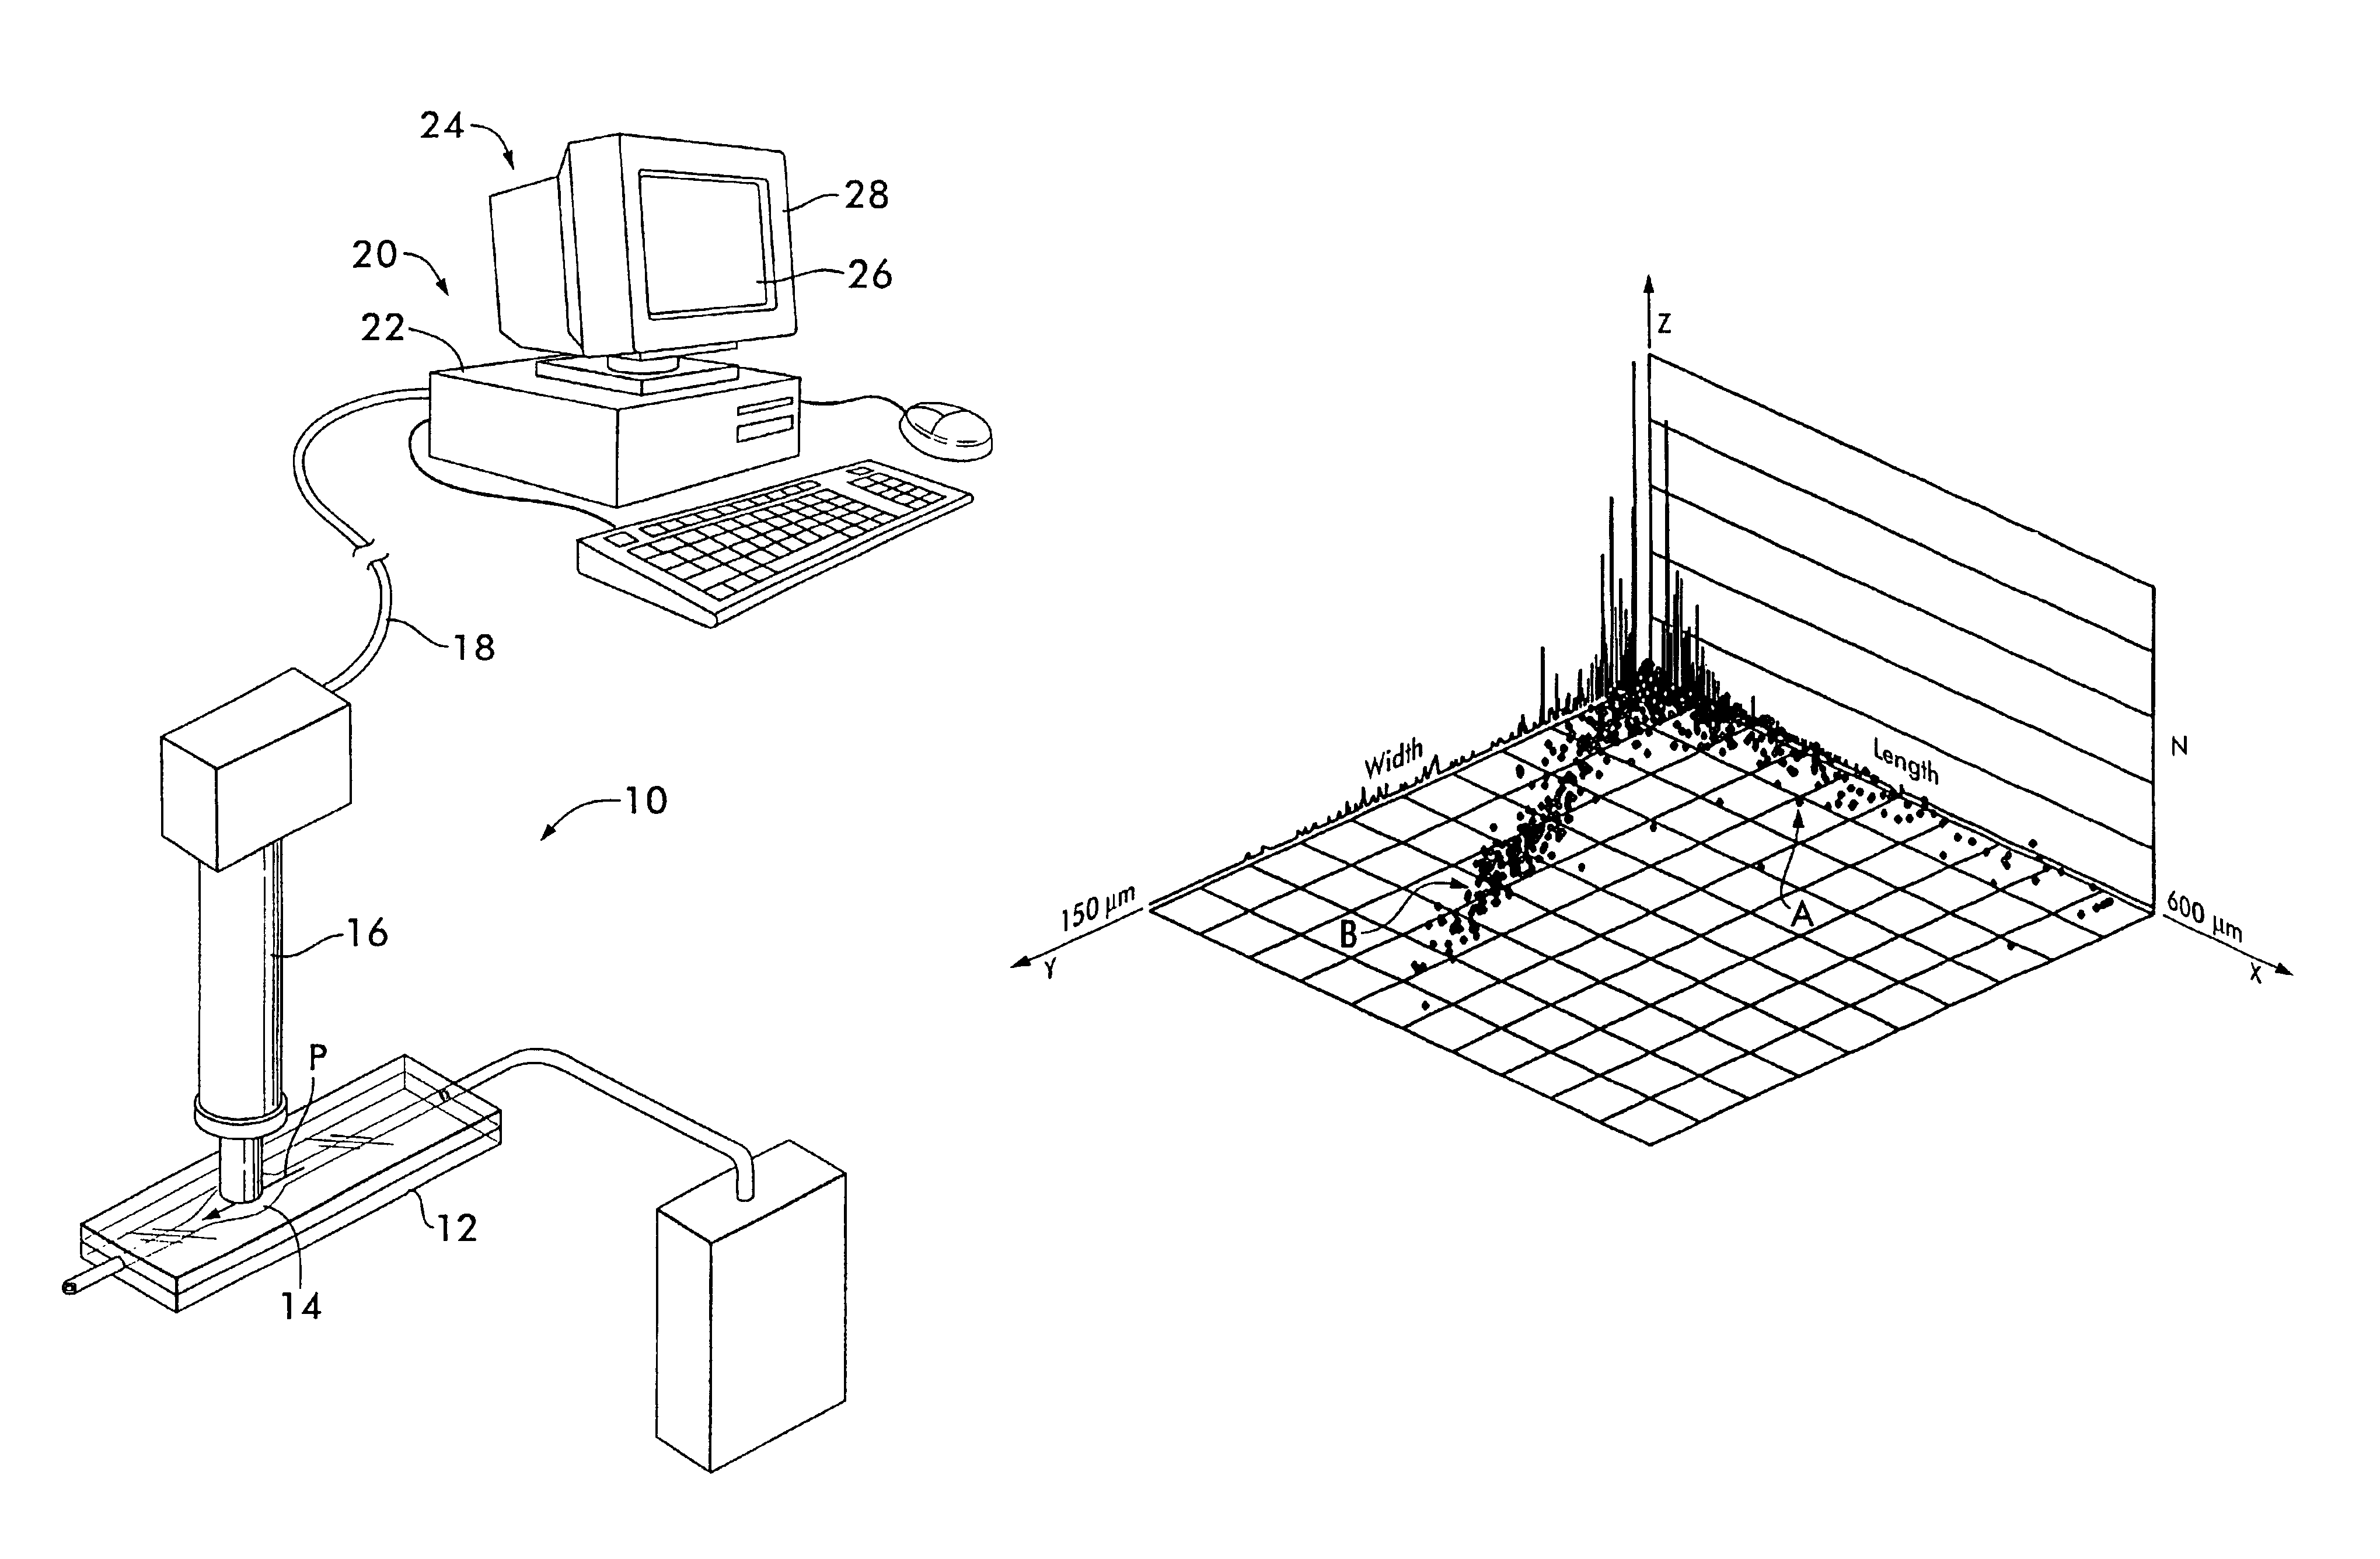
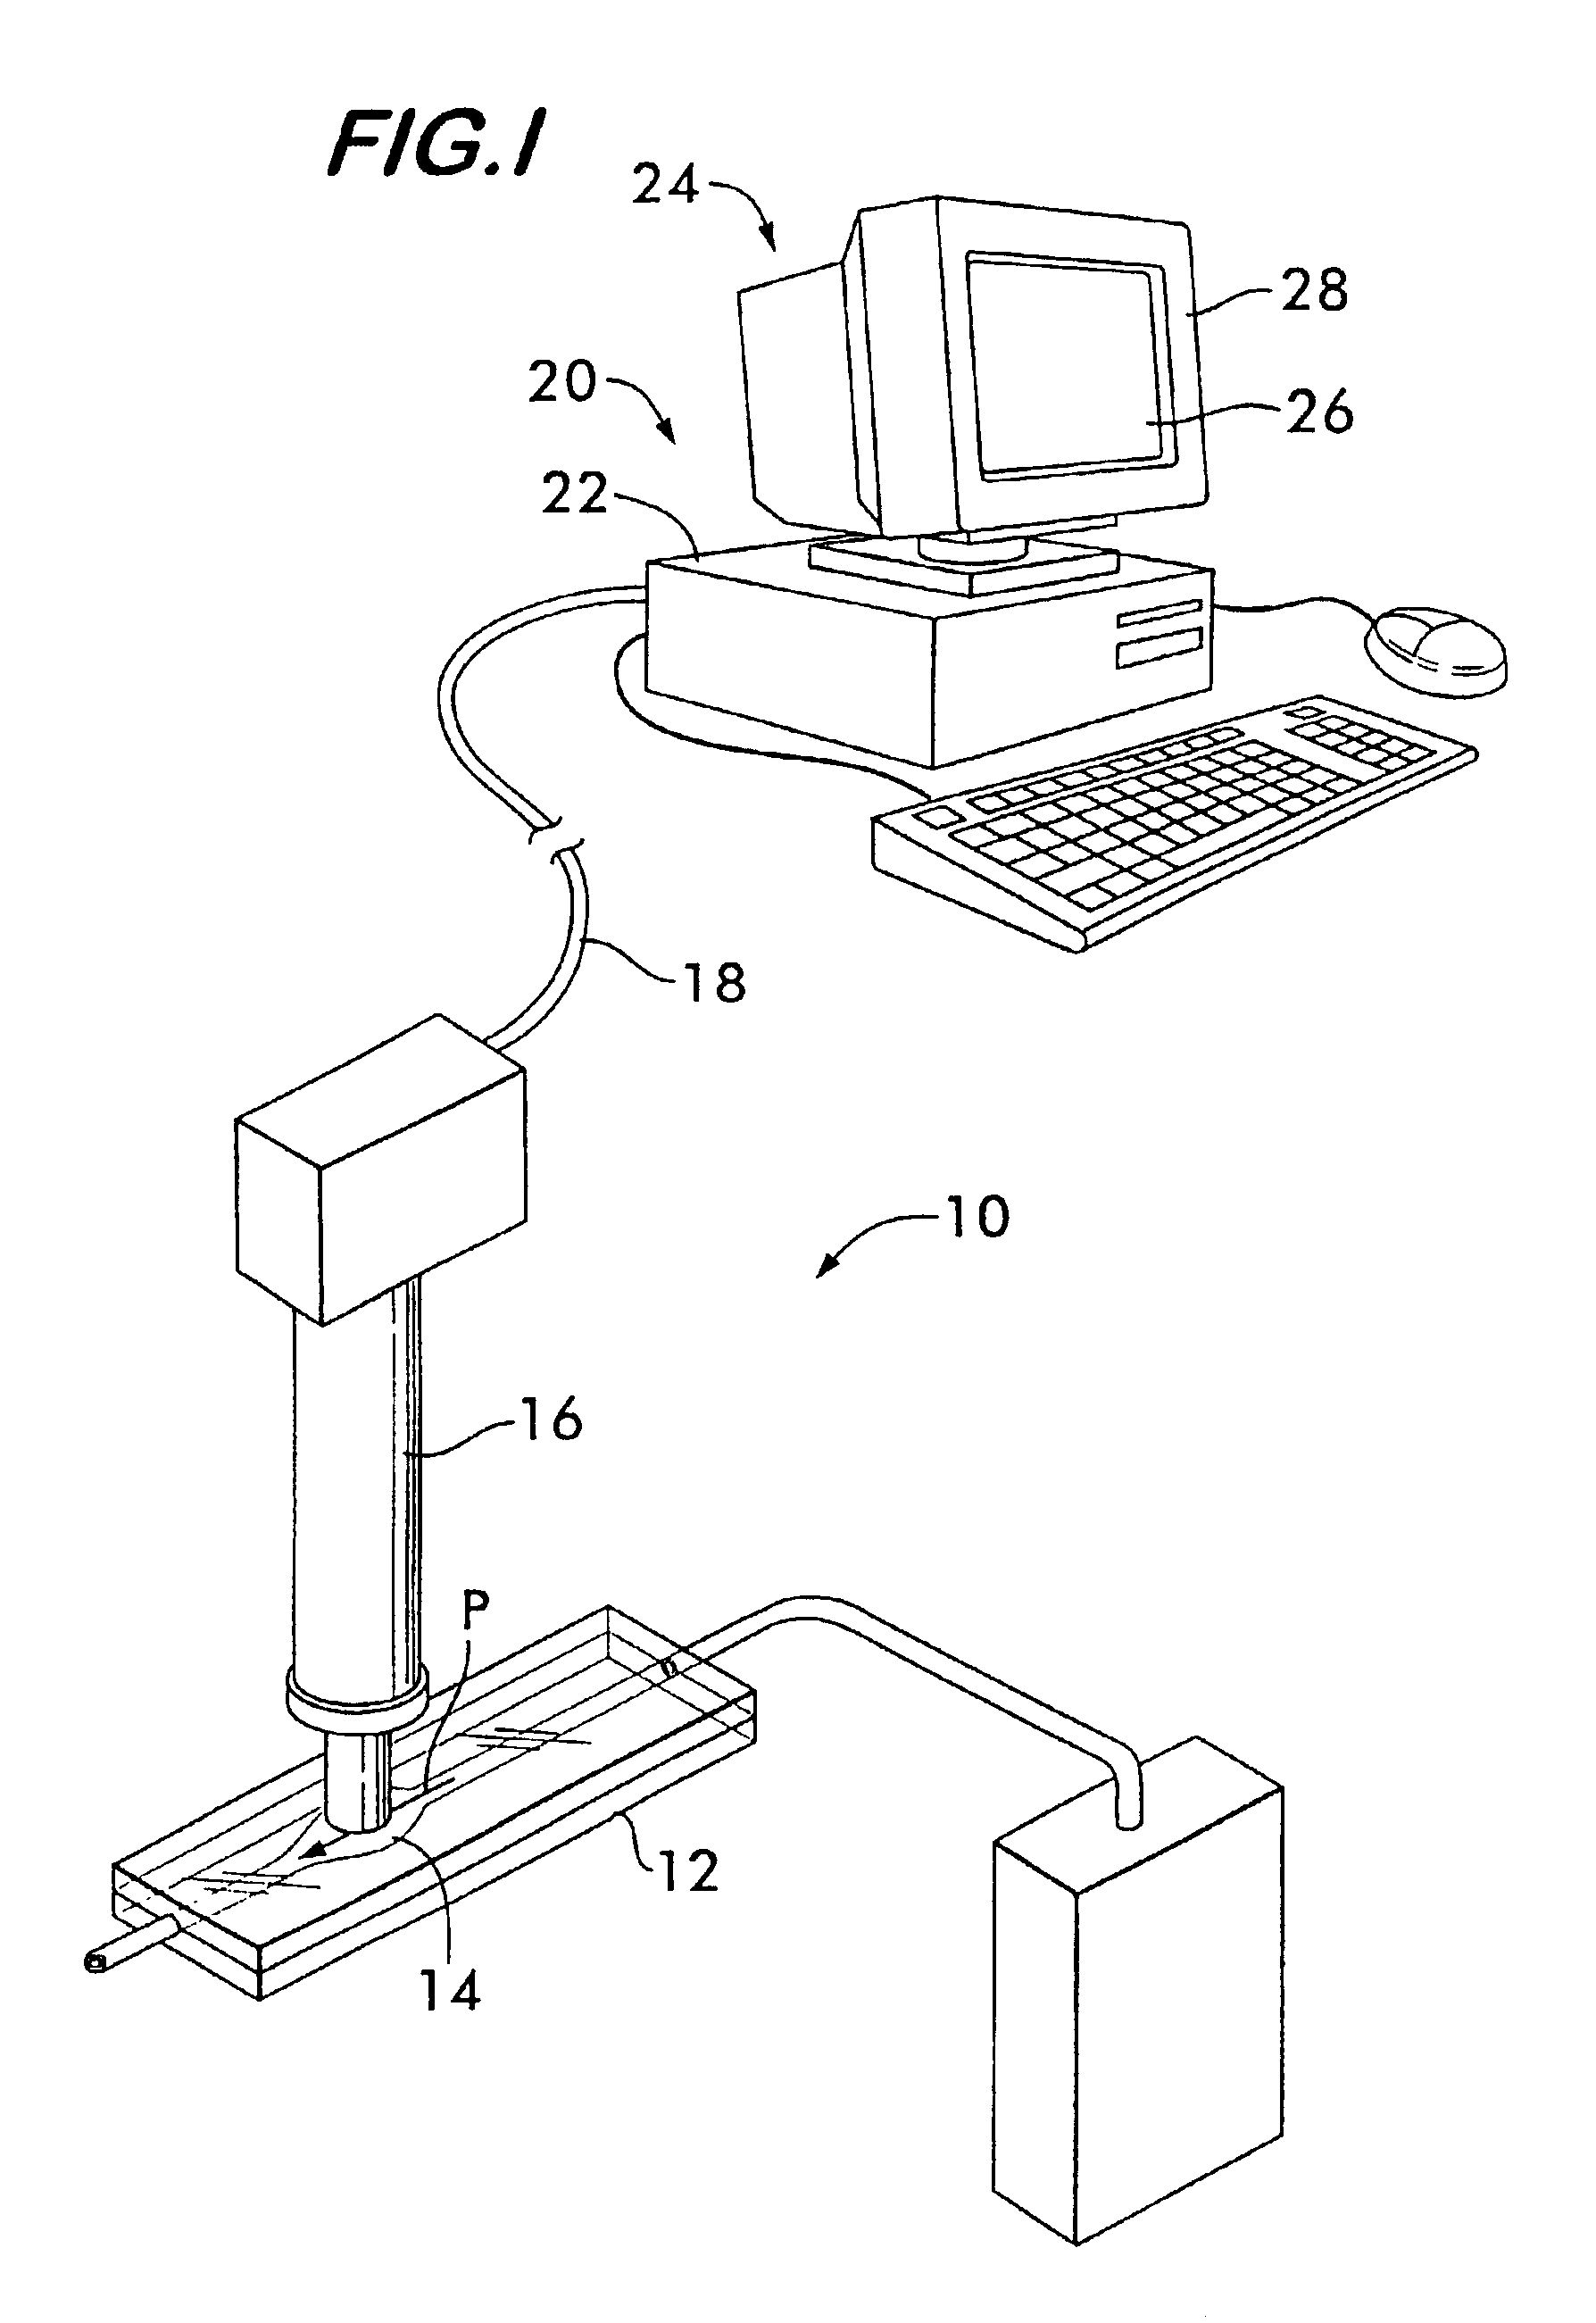
A dynamic image analysis measurement was performed on a sample having a plurality of fibrous particles suspended in a fluid medium. Presentations were prepared according to prior art techniques (FIGS. 2 and 3) and according to the present invention (FIG. 4).

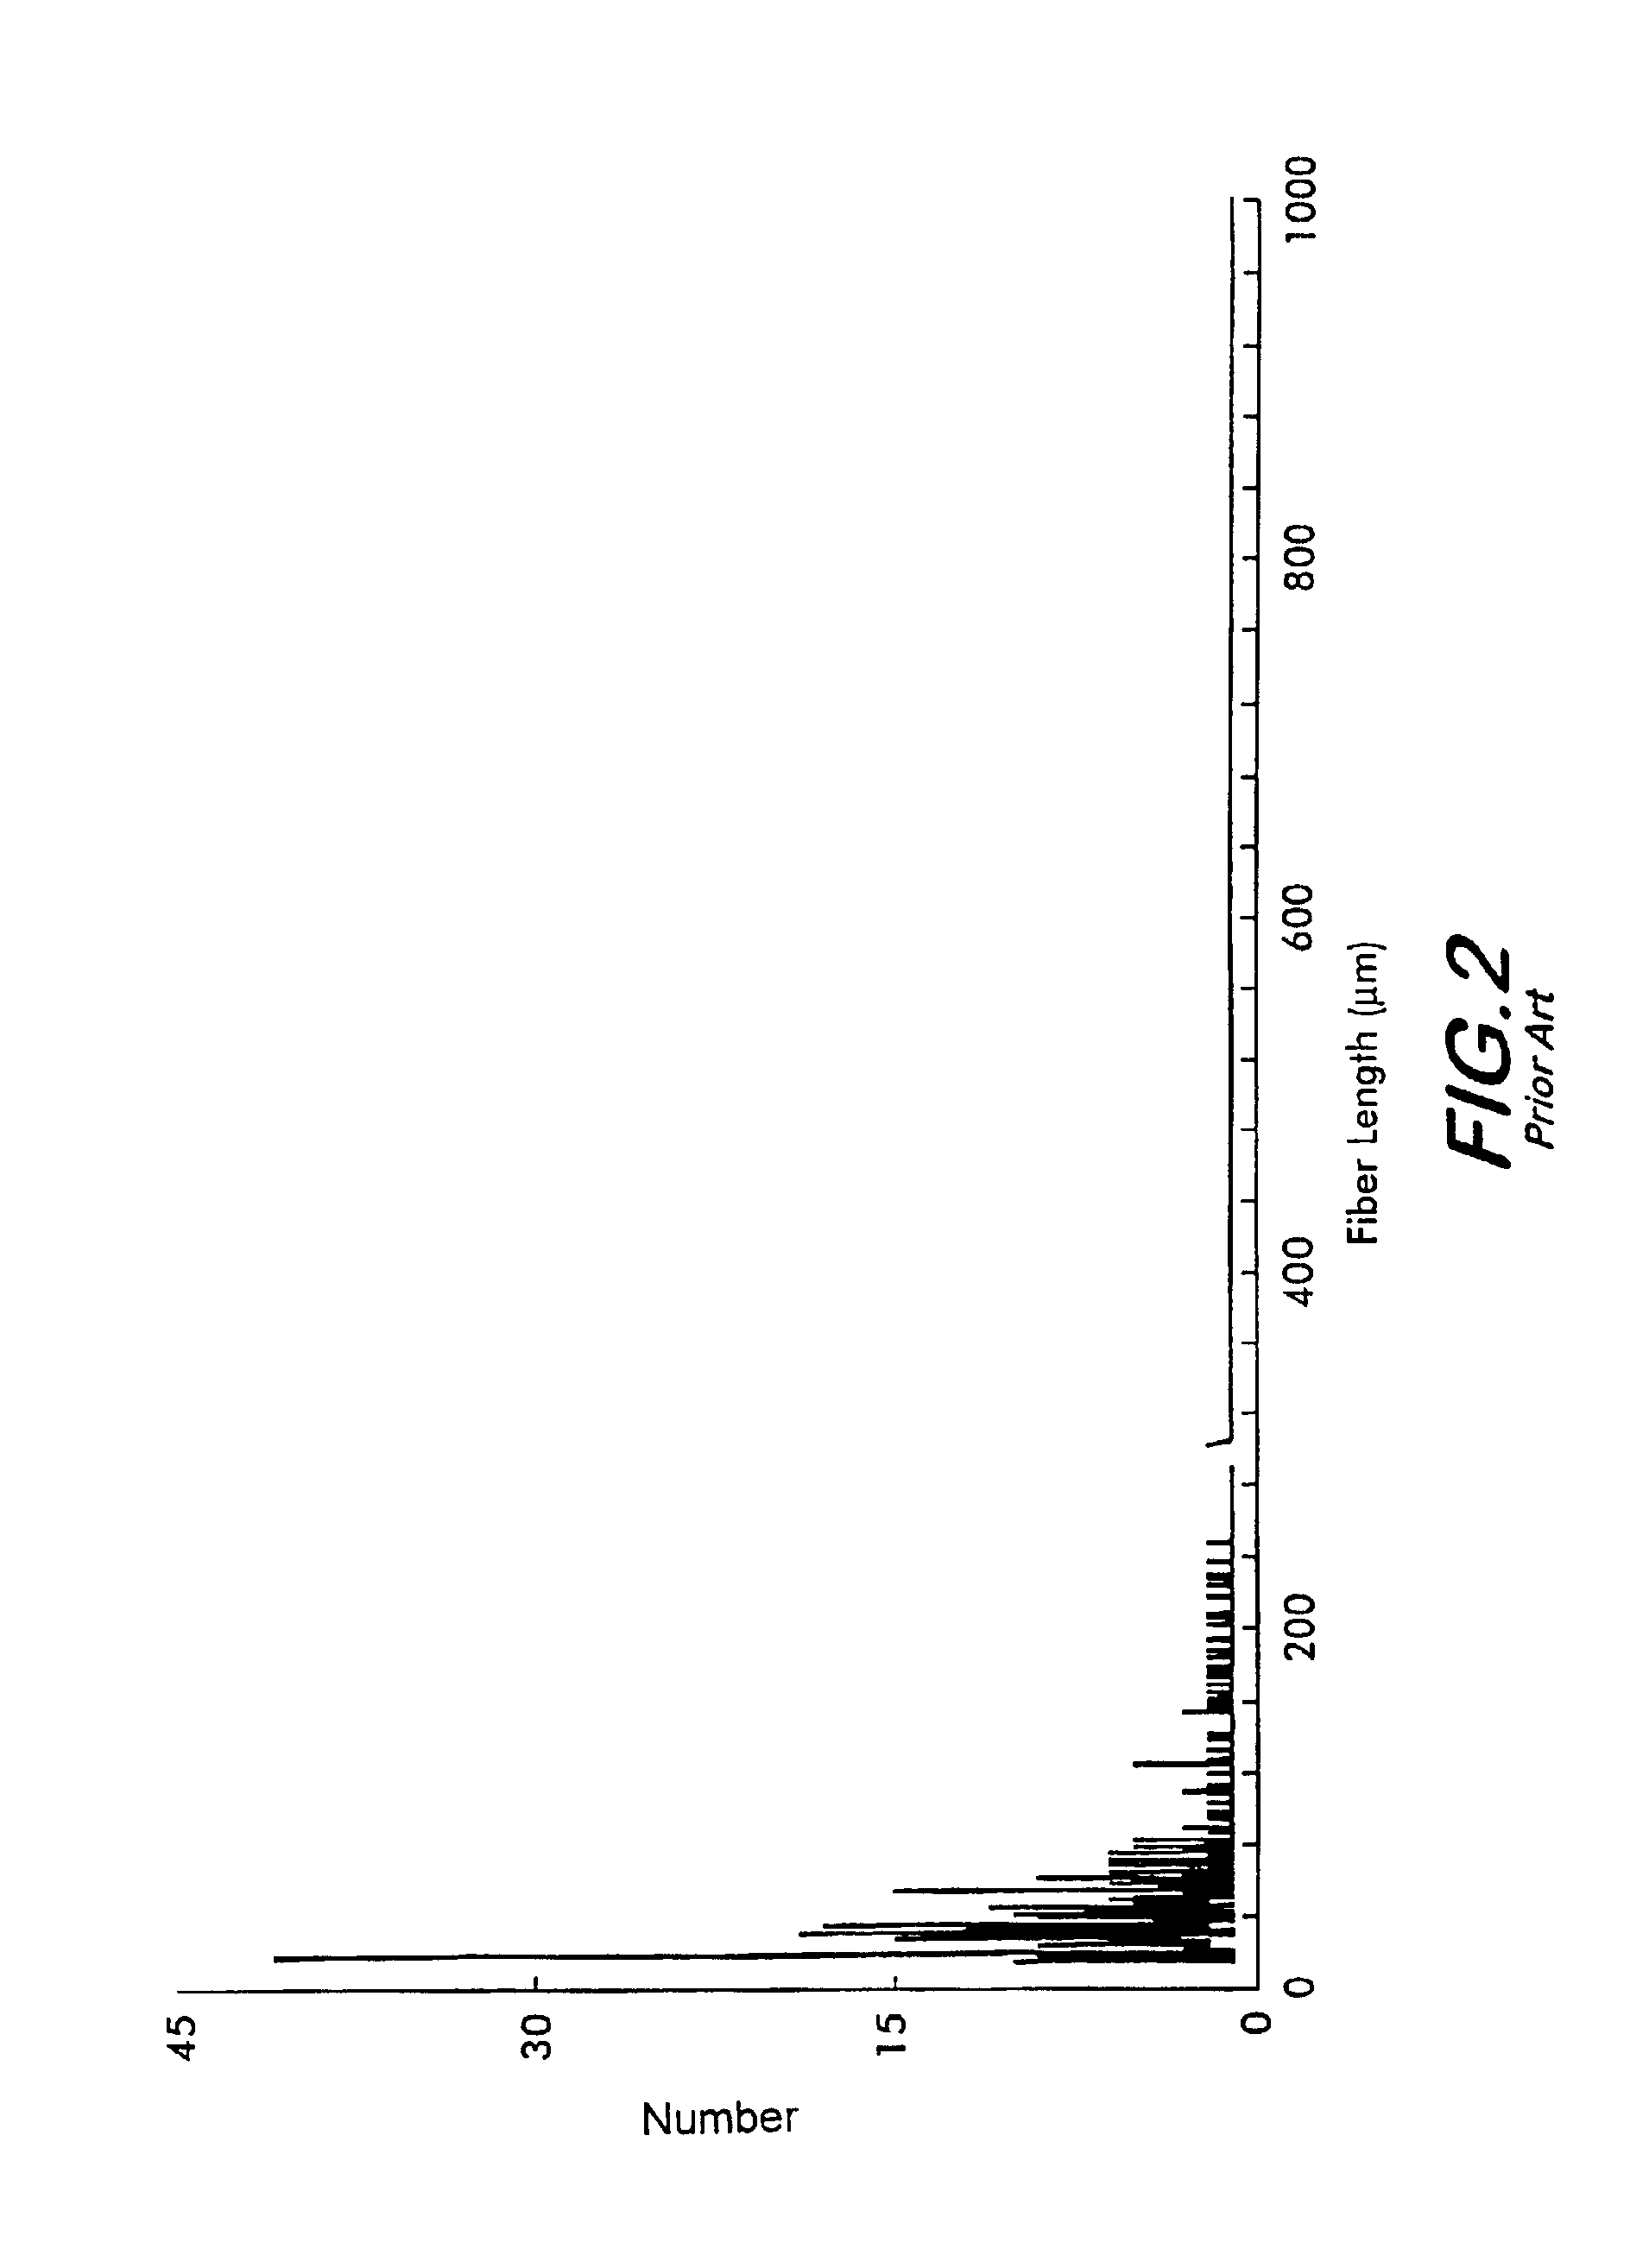
FIG. 2 is a two dimensional graph with the x-axis corresponding to fiber length and the y-axis corresponding to the number of occurrences of each particular fiber length. It discloses that the fibers in the sample are of a length ranging between about 0 to 300 μm and that the majority are less than about 80 μm. FIG. 3 is a two dimensional graph with the x-axis corresponding to fiber aspect ratio and the y-axis corresponding to the number of occurrences of each particular fiber aspect ratio. It discloses that the aspect ratio of the fibers range between about 0 to 30 and that the majority is within a range of about 1 to about 4. However, no further information can be readily determined from the graphs illustrated in F...

example no.2

EXAMPLE NO. 2

A dynamic image analysis measurement was performed on a sample having a mixture of glass bead particles suspended in a fluid medium. Presentations were prepared according to prior art techniques (FIG. 5) and according to the present invention (FIG. 6).

FIG. 5 is a two dimensional graph with the x-axis corresponding to particle equivalent circular diameter and the y-axis corresponding to the number of occurrences of each particular equivalent circular diameter. It discloses the existence of two groups of particles in which one has equivalent circular diameters below about 100 μm and the other is between about 150 to 250 μm. However, no further information can readily be determined from the graph.

FIG. 6 is a 3-D plot according to the present invention with one axis corresponding to an equivalent circular diameter, another axis corresponding to particle sphericity, and a third axis corresponding to the number of occurrences of a particular equivalent circular diameter and s...


PUM

PropertyMeasurementUnit
lengthaaaaaaaaaa
lengthaaaaaaaaaa
aspect ratioaaaaaaaaaa

Abstract

An apparatus and method in which a still image, or still images, are obtained of a plurality of particles suspended in a fluid medium. Each still image is transferred to an image analyzing unit that measures a set of dimensional characteristics per particle for particles appearing in the image and determine an occurrence characteristic for particles having a matching set of dimensional characteristics. Preferably, a three dimensional representation of the characteristics is displayed in real time. More preferably, the displayed three-dimensional representation is continuously updated and further entries are accumulated on the display as image analysis is performed. The display provides information to a viewer enabling the viewer to determine a shape distribution of the particles within the suspension even when multiple particle shapes are present.

Description

FIELD OF THE INVENTIONThe present invention relates to an apparatus and method for measuring and displaying a three dimensional size distribution of particles contained in a suspension, and more particularly, the present invention relates to an apparatus and method for presenting to a viewer a display which enables the viewer to quickly determine a size distribution of the particles within the suspension.BACKGROUND OF THE INVENTIONResearch and development of new products and techniques and quality control of existing products and techniques in many industries require the task of determining various characteristics, including for example dimensional characteristics, of particles a few millimeters or less in size. Typically, the particles are suspended in air or a liquid medium, and the size and shape of the particles vary greatly within a given sample of the suspension. For example, the various shapes may include substantially spherical, rod-shaped and plate-shaped particles to name ...

Claims


Application Information

Patent Timeline
Patent Type & Authority Patents(United States)
IPC IPC(8): G01N15/14G06T7/00
CPCG01N15/147G06T7/0004G01N2015/1497
Inventor XU, RENLIANG
Owner COULTER INTERNATIONAL CORPORATION
Why Eureka
Try Eureka