Prostate cancer diagnosis and outcome prediction by expression analysis
- Summary
- Abstract
- Description
- Claims
- Application Information
AI Technical Summary
Benefits of technology
Problems solved by technology
Method used
Image
Examples
example 1
Sample Identification
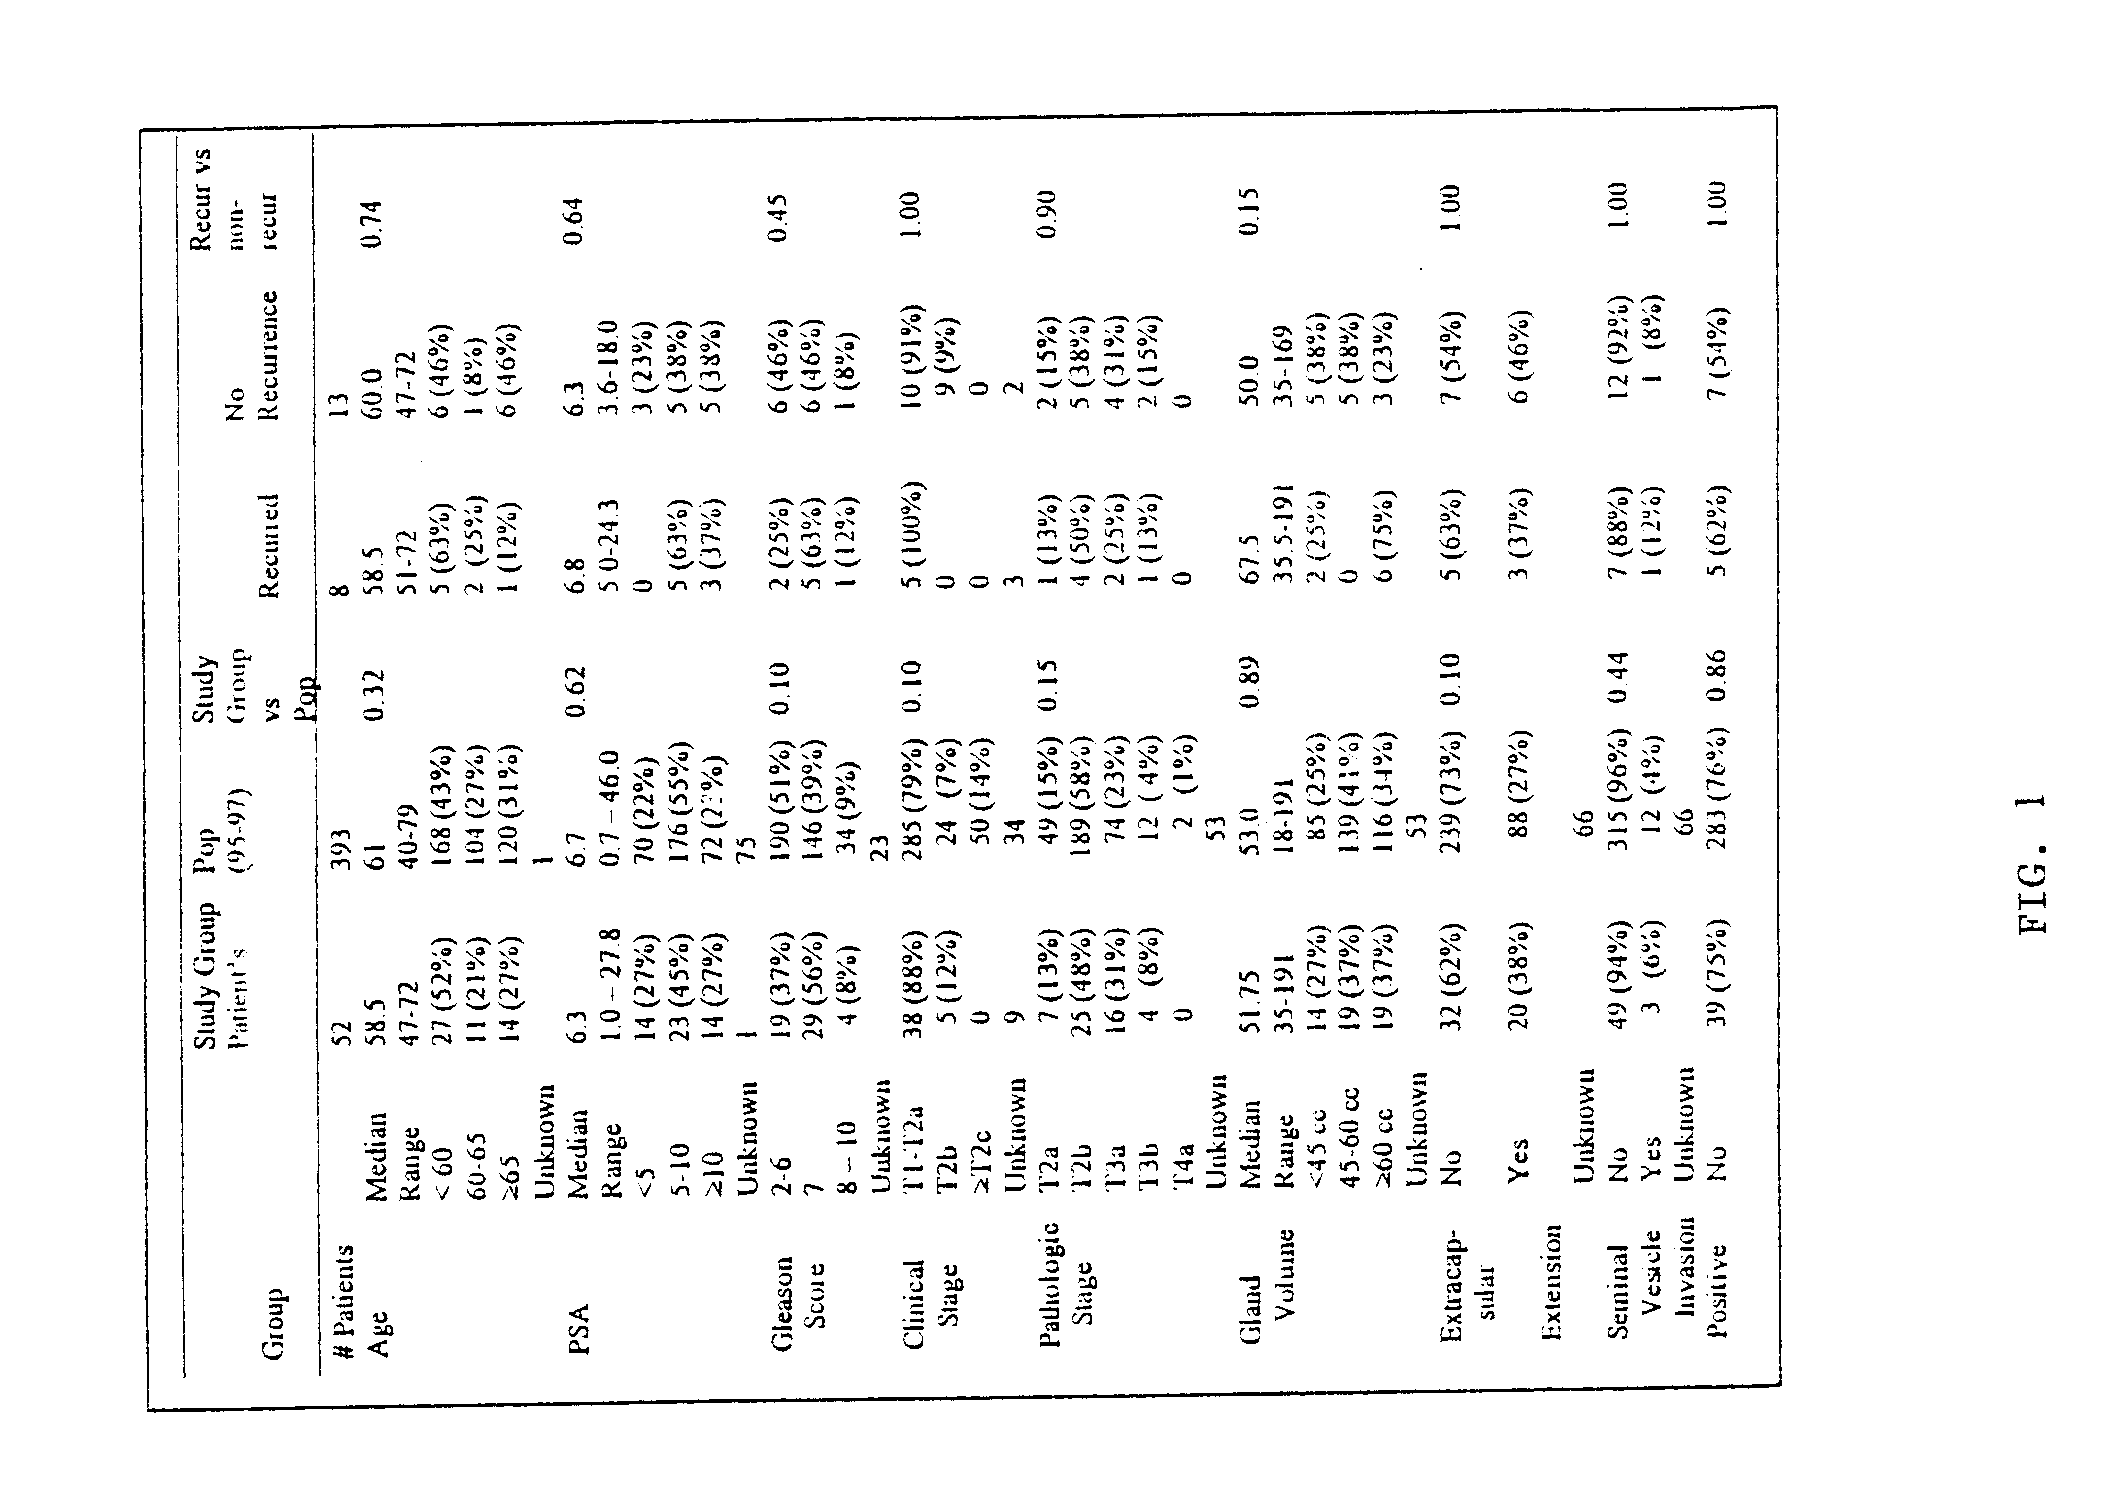
[0163]From 1995 to 1997, samples of prostate tumors and non-tumor prostate tissue (normal prostate tissue) were collected from consented patients undergoing radical prostatectomy at the Brigham and Women's Hospital (Boston, Mass.). Samples were embedded in optimal cutting temperature (OCT) solution, snap-frozen, and stored in liquid nitrogen. Two hundred thirty-five (235) tumor samples were cryosectioned and histologically reviewed by an experienced prostate pathologist. Sixty-five samples (27.7%) with tumor present on opposing sides of the sample that also had available corresponding normal tissue were included for further analysis. All tumor samples were prospectively reviewed by the same pathologist for Gleason score (described below) and all tumor and normal samples were reviewed to quantify the proportion of the sample comprised of tumor epithelium, normal epithelial, stromal, inflammatory and / or urothelial cells (when present). The original surgical pathol...
example 2
Preparation of Samples for Microarray Hybridization and Measurement of Gene Expression
[0165]High-quality oligonucleotide based expression data was obtained from 52 prostate tumors and 50 prostate samples lacking detectable tumor (referred to as “normal prostate” here forward) as follows. Total RNA was extracted from the OCT-embedded specimens after tissue homogenization (with a Polytron PT 2100 tissue homogenizer) using Trizol reagent (Life Technologies, Gaithersberg, Va.). During all processing, the thawing of specimens was minimized so as to limit RNA degradation. In two large batches, using pooled reagents and established methods (Golub, et al., Science 286: 531-537 (1999)), labeled cRNA (referred to as “target”) was synthesized for each sample from a minimum of 10 micrograms of total RNA. Seven replicate RNA samples (5 tumors and 2 normal samples) with excess RNA were included to assess expression variability introduced by sample preparation and hybridization. Four replicate sam...
example 3
Early Expression Analysis: Quality Assessment, Scaling, Filtering, and Statistical Methods
[0167]Gene expression files where overall microarray staining intensity, the percentage of genes detected, or the mean average difference were 2 standard deviations outside the mean level of the dataset were excluded. To minimize the effect of technical variation on subsequent analysis, expression files from each sample included in subsequent experiments were scaled together (also referred to as “normalized”). Files were scaled by multiplying the average difference of each gene by the ratio of the mean average difference for all genes on the sample array and the mean average difference of the selected reference microarray representing the median value for the mean average difference of all arrays.
[0168]To exclude genes with minimal variation, the average difference values were set at lower (10) and upper thresholds (16000) and genes without variation (<5-fold between any two samples) across the...
PUM
| Property | Measurement | Unit |
|---|---|---|
| Gene expression profile | aaaaa | aaaaa |
Abstract
Description
Claims
Application Information
 - R&D
- Intellectual Property
- Life Sciences
- Materials
- Tech Scout
- Unparalleled Data Quality
- Higher Quality Content
- 60% Fewer Hallucinations
Browse by: Latest US Patents, China's latest patents, Technical Efficacy Thesaurus, Application Domain, Technology Topic, Popular Technical Reports.
© 2025 PatSnap. All rights reserved.Legal|Privacy policy|Modern Slavery Act Transparency Statement|Sitemap|About US| Contact US: help@patsnap.com


