Determination of time difference of arrival in distributed sensor networks

a sensor network and time difference technology, applied in direction finders, acoustic wave reradiation, instruments, etc., can solve the problems that the optimisation procedures and performance analyses carried out in the continuous-time framework cannot be fully applicable, and many known cross-correlation techniques based, explicitly or implicitly, on the assumption of signal stationarity and noise gaussianity are only of limited practical use, so as to reduce the amount of data required, reduce data transmission requirements, and simple bandwidth-

Inactive Publication Date: 2007-01-30
MITSUBISHI ELECTRIC CORP
View PDF6 Cites 29 Cited by
  • Summary
  • Abstract
  • Description
  • Claims
  • Application Information

AI Technical Summary

Benefits of technology

[0026]The technique of crosslation can be implemented by processing the output waveform from one sensor according to signal events occurring in the outputs of another sensor. Accordingly, only one full waveform is required. In situations where the sensors are located remote from each other, this substantially reduces the amount of data required to be transmitted by the sensors and therefore enables the use of the invention in systems having limited communication capabilities, such as simple bandwidth-limited wireless links. A further reduction in data transmission requirements is achieved by using the aspect of the invention mentioned above whereby a TDOA calculation is performed by a sensor device by processing the output of the sensor of that device according to signal events detected by the sensor of another device. In this situation it is merely necessary to transmit data representing the timing of those signal events.

Problems solved by technology

As a result, many known cross-correlation techniques based, explicitly or implicitly, on the assumptions of signal stationarity and noise Gaussianity are only of limited practical use.
Furthermore, most practical implementations have to deal with discrete-time samples, so that the optimisation procedures and performance analyses carried out in the continuous-time framework cannot be fully applicable.

Method used


Image

  • Determination of time difference of arrival in distributed sensor networks
  • Determination of time difference of arrival in distributed sensor networks
  • Determination of time difference of arrival in distributed sensor networks

Examples


example 1

[0060]Assume that σn is the rms value of background noise with a rectangular frequency spectrum extending from 0 Hz to 2 kHz. If background noise has a Gaussian distribution, then the expected crossing rate achieves its maximum of 2310 crossings per second for L=0 i.e., the zero crossing rate. When the level L rises gradually to L=σn, L=2σn and L=3σn, the expected crossing rate will fall to 1340, 312 and 25 crossings per second. If L=4σn, then on average there will be less than one crossing per second.

[0061]Suppose now that the crossing level L has been set at L=4σn and that the detection crossing rate NDET(L) is equal to 1340 to achieve a very small value of the probability of false alarm. Assume also, for illustrative purposes, that an object-generated signal has the same rectangular spectrum as the background noise. In this case, a detection will be declared if the rms value σs of the signal is approximately at least four times larger than that of the noise.

[0062]The increased cr...

example 2

[0093]Assume that a signal being processed has a rectangular frequency spectrum extending from 0 Hz to 2 kHz.

[0094]If the signal is sampled only at 4 kHz, and each sample is represented by a 10-bit value, a signal segment of duration of 1 second will be represented by a set of 40,000 bits. This data set will have to be sent, via a suitable communication link, to a cross-correlator for TDOA determination.

[0095]As seen from Example 1, even for the lowest possible value of level L, i.e. L=0, the number of significant instants which need to be sent during 1-second interval is equal to 2310. A binary waveform representing those significant instants can be transmitted in a convenient manner by applying a bipolar phase or frequency modulation.

[0096]Therefore, mutual crosslation can use a simple modulation scheme in a communication link provided, for example, by a low-cost radio transceiver.

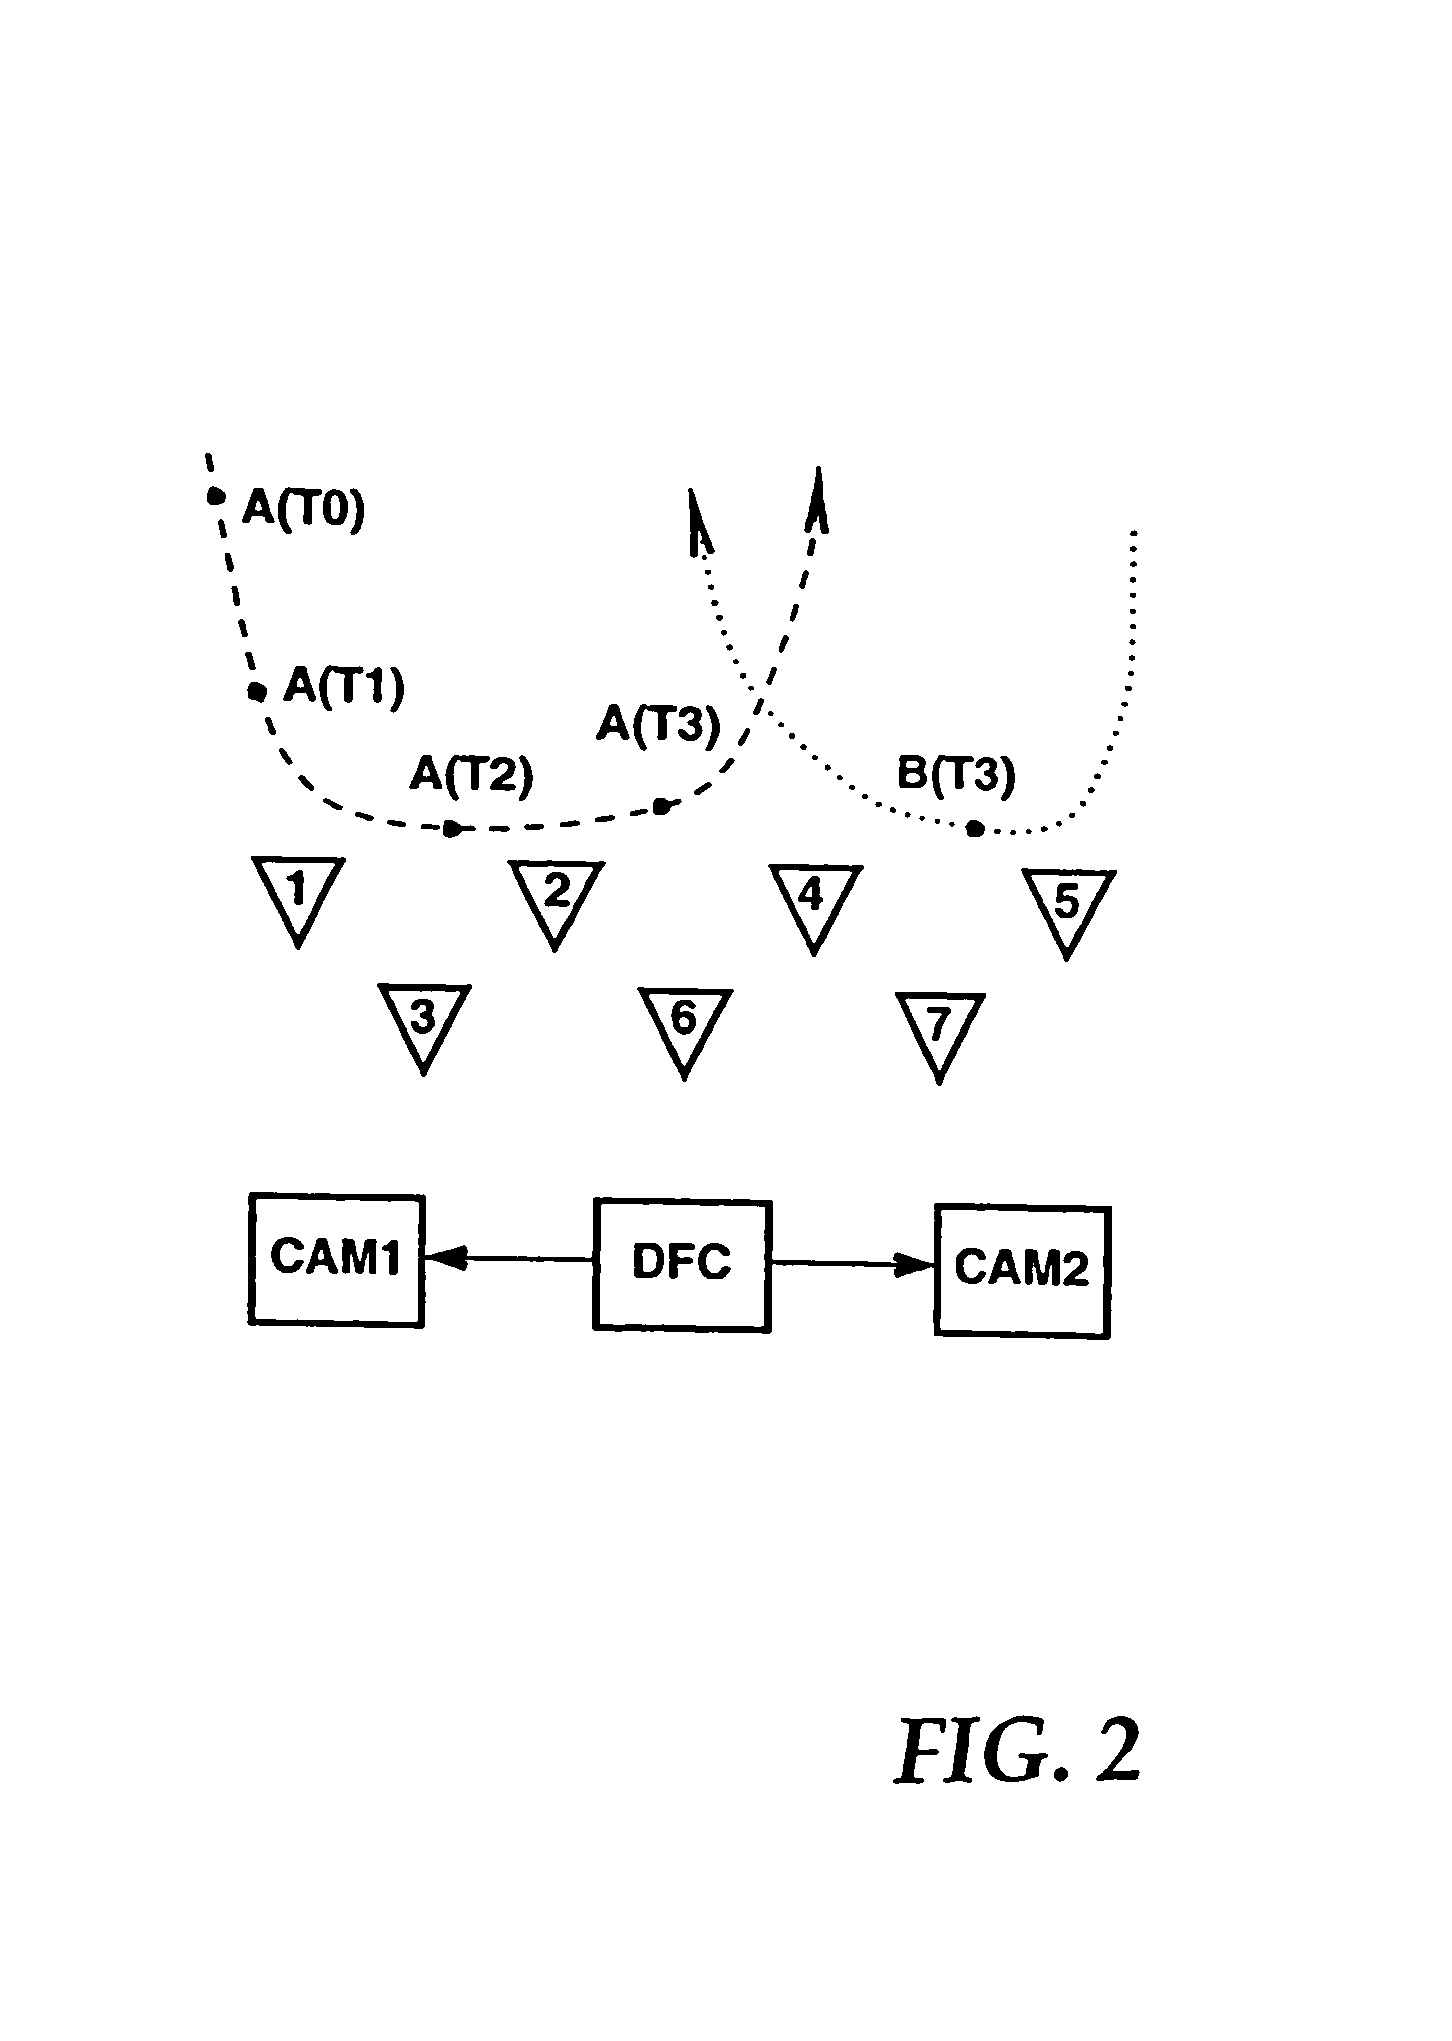
[0097]A data fusion centre DFC receives the following information:[0098]1. From each passive sensor d...


PUM


Abstract

An object localising system comprises sensor devices at different sites, each sensor device being capable of detecting a signal from an object, and control means for repeatedly responding to the outputs of the sensor devices by selecting a sub-set of the devices and determining the amount by which the times at which the devices of the sub-set receive the signal are delayed with respect to each other to enable calculation of the current location of the object. Each sensor device can be switched between a master mode, in which the device is operable to transmit events derived from a signal from an object, and a slave mode, in which the device is responsive to such events from another sensor device for processing its own signal in order to determine the time delay between receipt of the signals by the sensors of the respective devices.

Description

FIELD OF THE INVENTION[0001]This invention relates to a method and apparatus for determining the relative time delays between a plurality of signals, and is particularly but not exclusively applicable to a network of distributed passive sensors designed to detect and localise a non-cooperative source of acoustic energy by detecting delays between wideband signals.BACKGROUND OF THE INVENTION[0002]There are many circumstances in which there is a need to detect, identify, localise and track one or more non-cooperative objects of interest in some specified surveillance area. Such tasks can be performed by suitable active or passive sensors which can extract useful information by collaborative processing of signals reflected or emitted by those objects.[0003]In contrast to applications employing active sensors, such as radar or active sonar, in which the surveillance region of interest is illuminated by an interrogating energy waveform to obtain object-backscattered returns, passive sens...

Claims


Application Information

Patent Timeline
Patent Type & Authority Patents(United States)
IPC IPC(8): G01S3/808G01S3/80G01S5/26G01S5/06G01S5/22G01S13/00G01S13/87G01S15/06G01S15/66G01S15/87
CPCG01S15/876G01S13/878G01S5/06G01S5/22G01S13/003
Inventor SZAJNOWSKI, WIESLAW JERZY
Owner MITSUBISHI ELECTRIC CORP
Why Eureka
Try Eureka