Transaction breakdown feature to facilitate analysis of end user performance of a server system

a technology of server system and transaction breakdown, applied in the field of software tools and services, can solve the problems of not detecting a performance problem seen by the most frequent users of the system, unable to detect problems, and existing tools and services often fail to identify specific attributes, so as to efficiently identify the root causes of performance problems

Inactive Publication Date: 2007-03-27
MICRO FOCUS LLC
View PDF46 Cites 235 Cited by
  • Summary
  • Abstract
  • Description
  • Claims
  • Application Information

AI Technical Summary

Benefits of technology

[0012]The present invention addresses these and other problems by providing a software system and method for monitoring the post-deployment operation of a web site system or other transactional server. In a preferred embodiment, the system includes an agent component (“agent”) that simulates the actions of actual users of the transactional server while monitoring and reporting the server's performance. In accordance with one aspect of the invention, the agent is adapted to be installed on selected computers (“agent computers”) to be used for monitoring, including computers of actual end users. For example, the agent could be installed on selected end-user computers within the various offices or organizations from which the transactional server is commonly accessed. Once the agent component has been installed, the agent computers can be remotely programmed (typically by the operator of the transactional server) using a controller component (“controller”). The ability to flexibly select the computers to be used for monitoring purposes, and to use actual end-user computers for monitoring, greatly facilitates the task of detecting problems associated with the attributes of typical end users.
[0015]In accordance with another aspect of the invention, the reports server generates reports which indicate the performance of the transactional server separately for the various operator-specified attributes. Using this feature, the user can, for example, view and compare the performance of the transactional server as seen from different operator-specified locations (e.g., New York, San Francisco, and U.K.), organizations (e.g., accounting, marketing, and customer service departments), ISPs (e.g., Spring, AOL and Earthlink), or other attribute type. The user may also have the option to filter out data associated with particular attributes and / or transactions (e.g., exclude data associated with AOL customers), and to define new attribute types (e.g., modem speed or operating system) for partitioning the performance data. The ability to monitor the performance data according to the operator-specified attributes greatly facilitates the task of isolating and correcting attribute-dependant performance problems.
[0020]In accordance with another aspect of the invention, a server agent component is configured to monitor server resource utilization parameters concurrently with the monitoring of transaction response times, or other response times, by a client-side. The server agent component is preferably located local to the monitored transactional server. The performance data generated by the client and server agents is aggregated in a centralized database that is remotely accessible through a web reports server. The reports server provides various user-configurable charts, tables and graphs displaying the response times and server resource utilization parameters, and provides functions for facilitating an evaluation of whether a correlation exists between changes in the response times and changes in values of specific server resource utilization parameters. Using this feature, a user can identify the server-side sources of performance problems seen by end users.
[0023]The results of the RCA analysis are preferably presented in an expandable tree collections of related measurements are represented by nodes, and in which parent-child relationships between the nodes indicate predefined dependencies between performance parameters. The nodes are color coded, or otherwise displayed, to indicate performance or quality levels of the respective sets of measurements they represent. The tree thus reveals correlations between performance degradations in different parameters (e.g., server time and CPU utilization), allowing users to efficiently identify root causes of performance problems.

Problems solved by technology

A significant problem with existing monitoring tools and services is that they often fail to detect problems that are dependent upon the attributes of typical end users, such as the user's location, PC configuration, ISP (Internet Service Provider), or Internet router.
For example, with some web site monitoring services, the web site operator can monitor the web site only from the agent computers and locations made available by the service provider; as a result, the service may not detect a performance problem seen by the most frequent users of the system (e.g., members of a customer service department who access the web site through a particular ISP, or who use a particular PC configuration).
Even when such attribute-specific problems are detected, existing tools and services often fail to identify the specific attributes that give rise to the problem.
For example, a monitoring service may indicate that web site users in a particular city are experiencing long delays, but may fail to reveal that the problem is experienced only by users that access the site through a particular router.
Without such additional information, system administrators may not be able to isolate and correct such problems.
Another significant problem with existing tools and services is that they do not provide an adequate mechanism for monitoring the current status of the transactional server, and for promptly notifying system administrators when a problem occurs.
As a result, many end users may experience the problem before a system administrator becomes aware of the problem.
Another significant problem with prior tools and services is that they generally do not provide a mechanism for identifying the source of performance problem.
For instance, a web site monitoring service may determine that users are currently experiencing unusually long response times, but typically will not be capable of determining the source of the problem.
For instance, the RCA process may determine that “server time” was unusually high during a time period in which the performance degradation occurred, indicating that the server itself was the likely source of the degradation in end user performance.

Method used


Image

  • Transaction breakdown feature to facilitate analysis of end user performance of a server system
  • Transaction breakdown feature to facilitate analysis of end user performance of a server system
  • Transaction breakdown feature to facilitate analysis of end user performance of a server system

Examples


Embodiment Construction

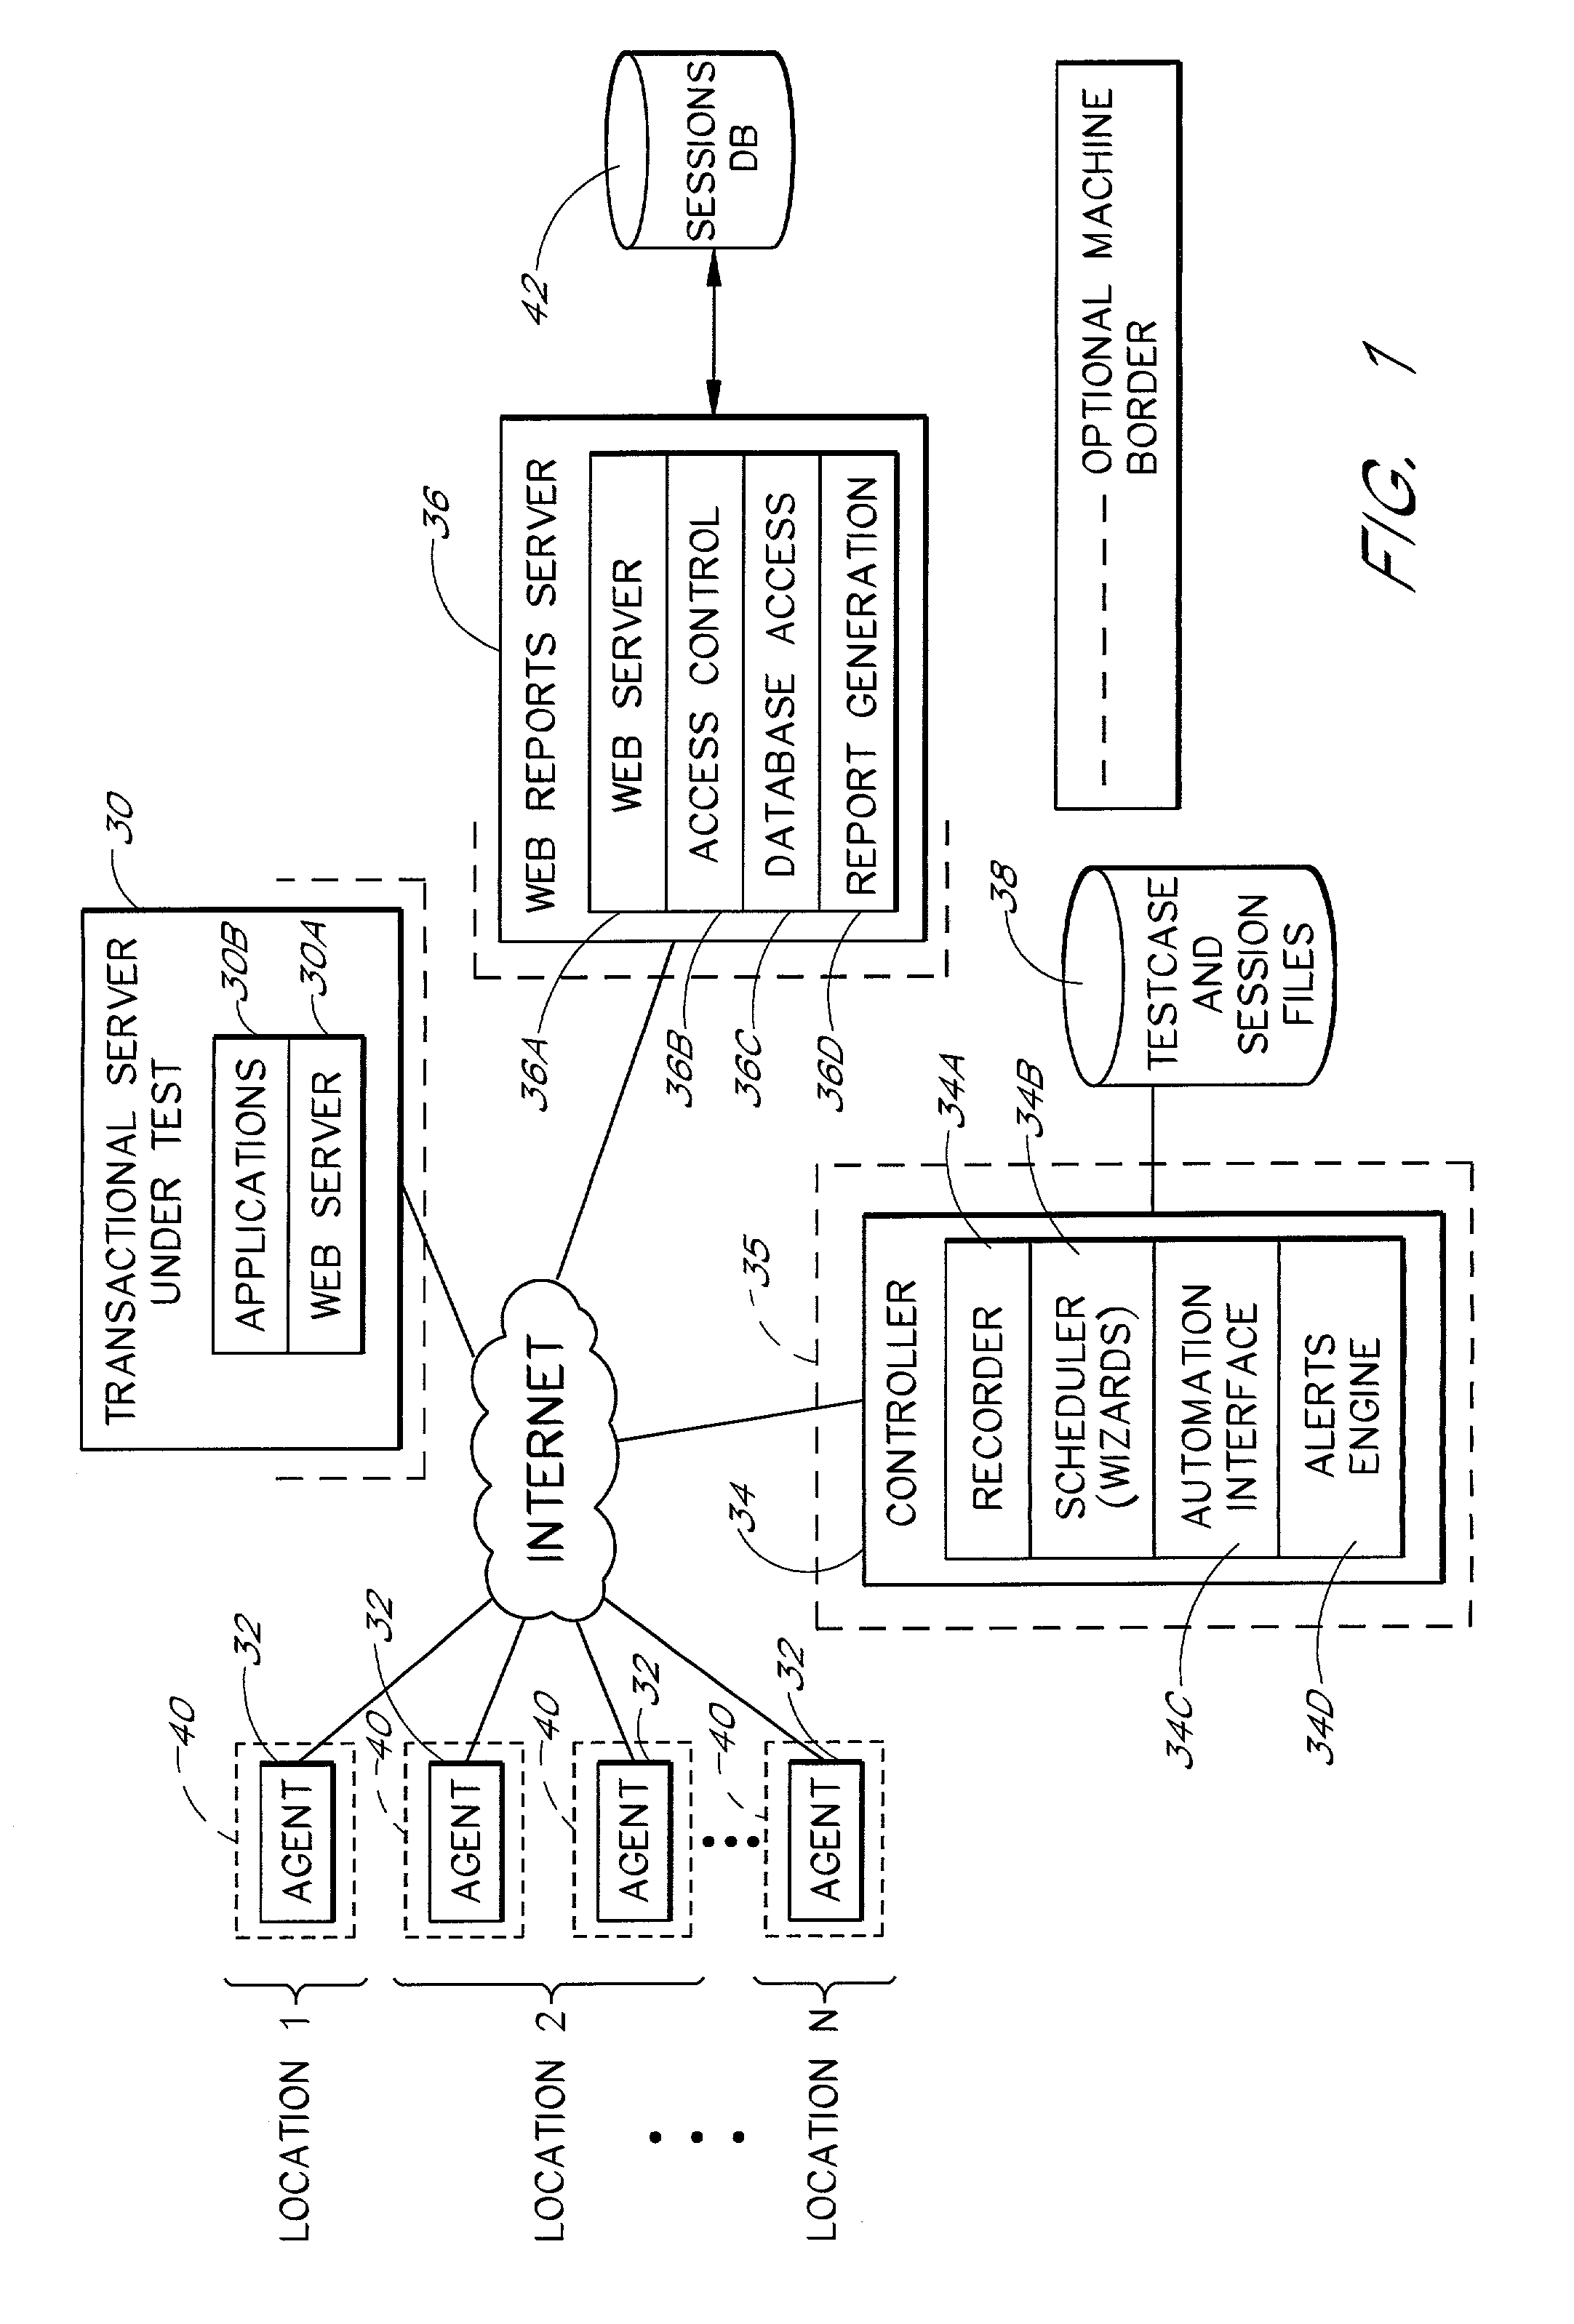
[0049]Various inventive features will now be described with reference to a distributed monitoring tool and service for monitoring transactional servers. Although these features are described as part of a common monitoring system, those skilled in the art will recognize that many of these features can be practiced or used independently of others. In addition, the inventive features can be implemented differently than described herein, and / or within a different type of system (such as a load testing tool or service). Accordingly, the following description is intended only to illustrate certain embodiments of the invention, and not to limit the scope of the invention. The scope of the invention is defined only by the appended claims.

[0050]Throughout the following description, it will be assumed that the transactional server being monitored is a web-based system that is accessible via the Internet. It will be recognized, however, that the inventive methods and features can also be used ...


PUM


Abstract

A system for monitoring the post-deployment performance of a web-based or other transactional server is disclosed. The monitoring system includes an agent component that monitors the performance of the transactional server as seen from one or more geographic locations and reports the performance data to a reports server and / or centralized database. The performance data may include, for example, transaction response times, server response times, network response times and measured segment delays along network paths. Using the reported performance data, the system provides a breakdown of time involved in completion of a transaction into multiple time components, including a network time and a server time. Users view the transaction breakdown data via a series of customizable reports, which assist the user in determining whether the source of the performance problem. Additional features permit the source to be identified with further granularity.

Description

RELATED APPLICATIONS[0001]This application claims the benefit of U.S. Provisional Appl. No. 60 / 289,923, filed May 9, 2001, the disclosure of which is hereby incorporated by reference. The disclosure of U.S. application Ser. No. 09 / 484,686, filed Jan. 17, 2000, is bodily incorporated herein to facilitate an understanding of certain embodiments of the present invention.FIELD OF THE INVENTION[0002]The present invention relates to software tools and services for testing and monitoring the operation of web-based and other transactional servers.BACKGROUND OF THE INVENTION[0003]A variety of commercially-available software tools exist for assisting companies in testing the performance and functionality of their web-based transactional servers and associated applications prior to deployment. Examples of such tools include the LoadRunner®, WinRunner® and Astra QuickTest® products of Mercury Interactive Corporation, the assignee of the present application.[0004]Using these products, a user can...

Claims


Application Information

Patent Timeline
Patent Type & Authority Patents(United States)
IPC IPC(8): G06F15/173G06F11/32G06F11/34H04L12/24H04L12/26H04L29/06H04L29/08
CPCG06F11/323G06F11/3419H04L29/06H04L41/046H04L41/22H04L41/5009H04L43/14H04L67/22H04L69/329G06F11/3495G06F2201/875H04L43/045H04L43/067H04L43/0852H04L43/10H04L43/106H04L43/16G06F2201/86G06F2201/87H04L67/02G06F11/3414H04L67/535H04L9/40
Inventor GOLDSTEIN, GUYSARIG, IDOHADDAD, REFAELFRAENKEL, NOAM
Owner MICRO FOCUS LLC
Why Eureka
Try Eureka