System, method, and computer program product for analyzing spectrometry data to identify and quantify individual components in a sample

a spectrometry data and computer program technology, applied in the field of nonnegative factorization functions and/or correlation functions, can solve the problems of large computational power, large time and computational power consumed in the sorting of metabolomic data taken from a variety of biological samples (i.e., from a patient population), and the inability to identify specific individual metabolites. combinations and interplay of such ions,

Active Publication Date: 2009-07-14
METABOLON
View PDF11 Cites 28 Cited by
  • Summary
  • Abstract
  • Description
  • Claims
  • Application Information

AI Technical Summary

Problems solved by technology

While genomics (study of the DNA-level biochemistry), transcript profiling (study of the RNA-level biochemistry), and proteomics (study of the protein-level biochemistry) are useful for identification of disease pathways, these methods are complicated by the fact that there exist over 25,000 genes, 100,000 to 200,000 RNA transcripts and up to 1,000,000 proteins in human cells.
However, the collection and sorting of metabolomic data taken from a variety of biological samples (i.e., from a patient population) consumes large amounts of time and computational power.
While individual ions may be detectable in such spectra, the combinations and interplay of such ions to indicate specific individual metabolite compounds may not be immediately discernable, especially in only a single biological sample.
However, in many cases, the fractionation of a particular biological sample (in a liquid or gas chromatograph, for example) is incomplete.
While subjectively comparing deconstructed spectral plots to spectral characteristic plots may be useful for identifying the potential presence of more complex mixtures of components in a given type of biological sample, such subjective comparisons still do not provide quantitative information related to the relative amounts of particular components (such as metabolites, small molecule therapeutic agents, metabolized drugs, and xenobiotics, for example) that may be present in a particular sample.
However, FA, PCA, and SVD analytic methods provide results that are often ambiguous and / or difficult to interpret because the basic spectral profiles may include a number of negative values (having no meaningful analytical value).
In addition, FA, PCA, and SVD analytical methods do not necessarily yield results that point to independent groups of ions indicative of particular metabolite compounds or other components present in the samples, as described for example by Juvela et al.

Method used


Image

  • System, method, and computer program product for analyzing spectrometry data to identify and quantify individual components in a sample
  • System, method, and computer program product for analyzing spectrometry data to identify and quantify individual components in a sample
  • System, method, and computer program product for analyzing spectrometry data to identify and quantify individual components in a sample

Examples


Embodiment Construction

[0029]The present invention now will be described more fully hereinafter with reference to the accompanying drawings, in which some, but not all embodiments of the invention are shown. Indeed, the invention may be embodied in many different forms and should not be construed as limited to the embodiments set forth herein; rather, these embodiments are provided so that this disclosure will satisfy applicable legal requirements. Like numbers refer to like elements throughout.

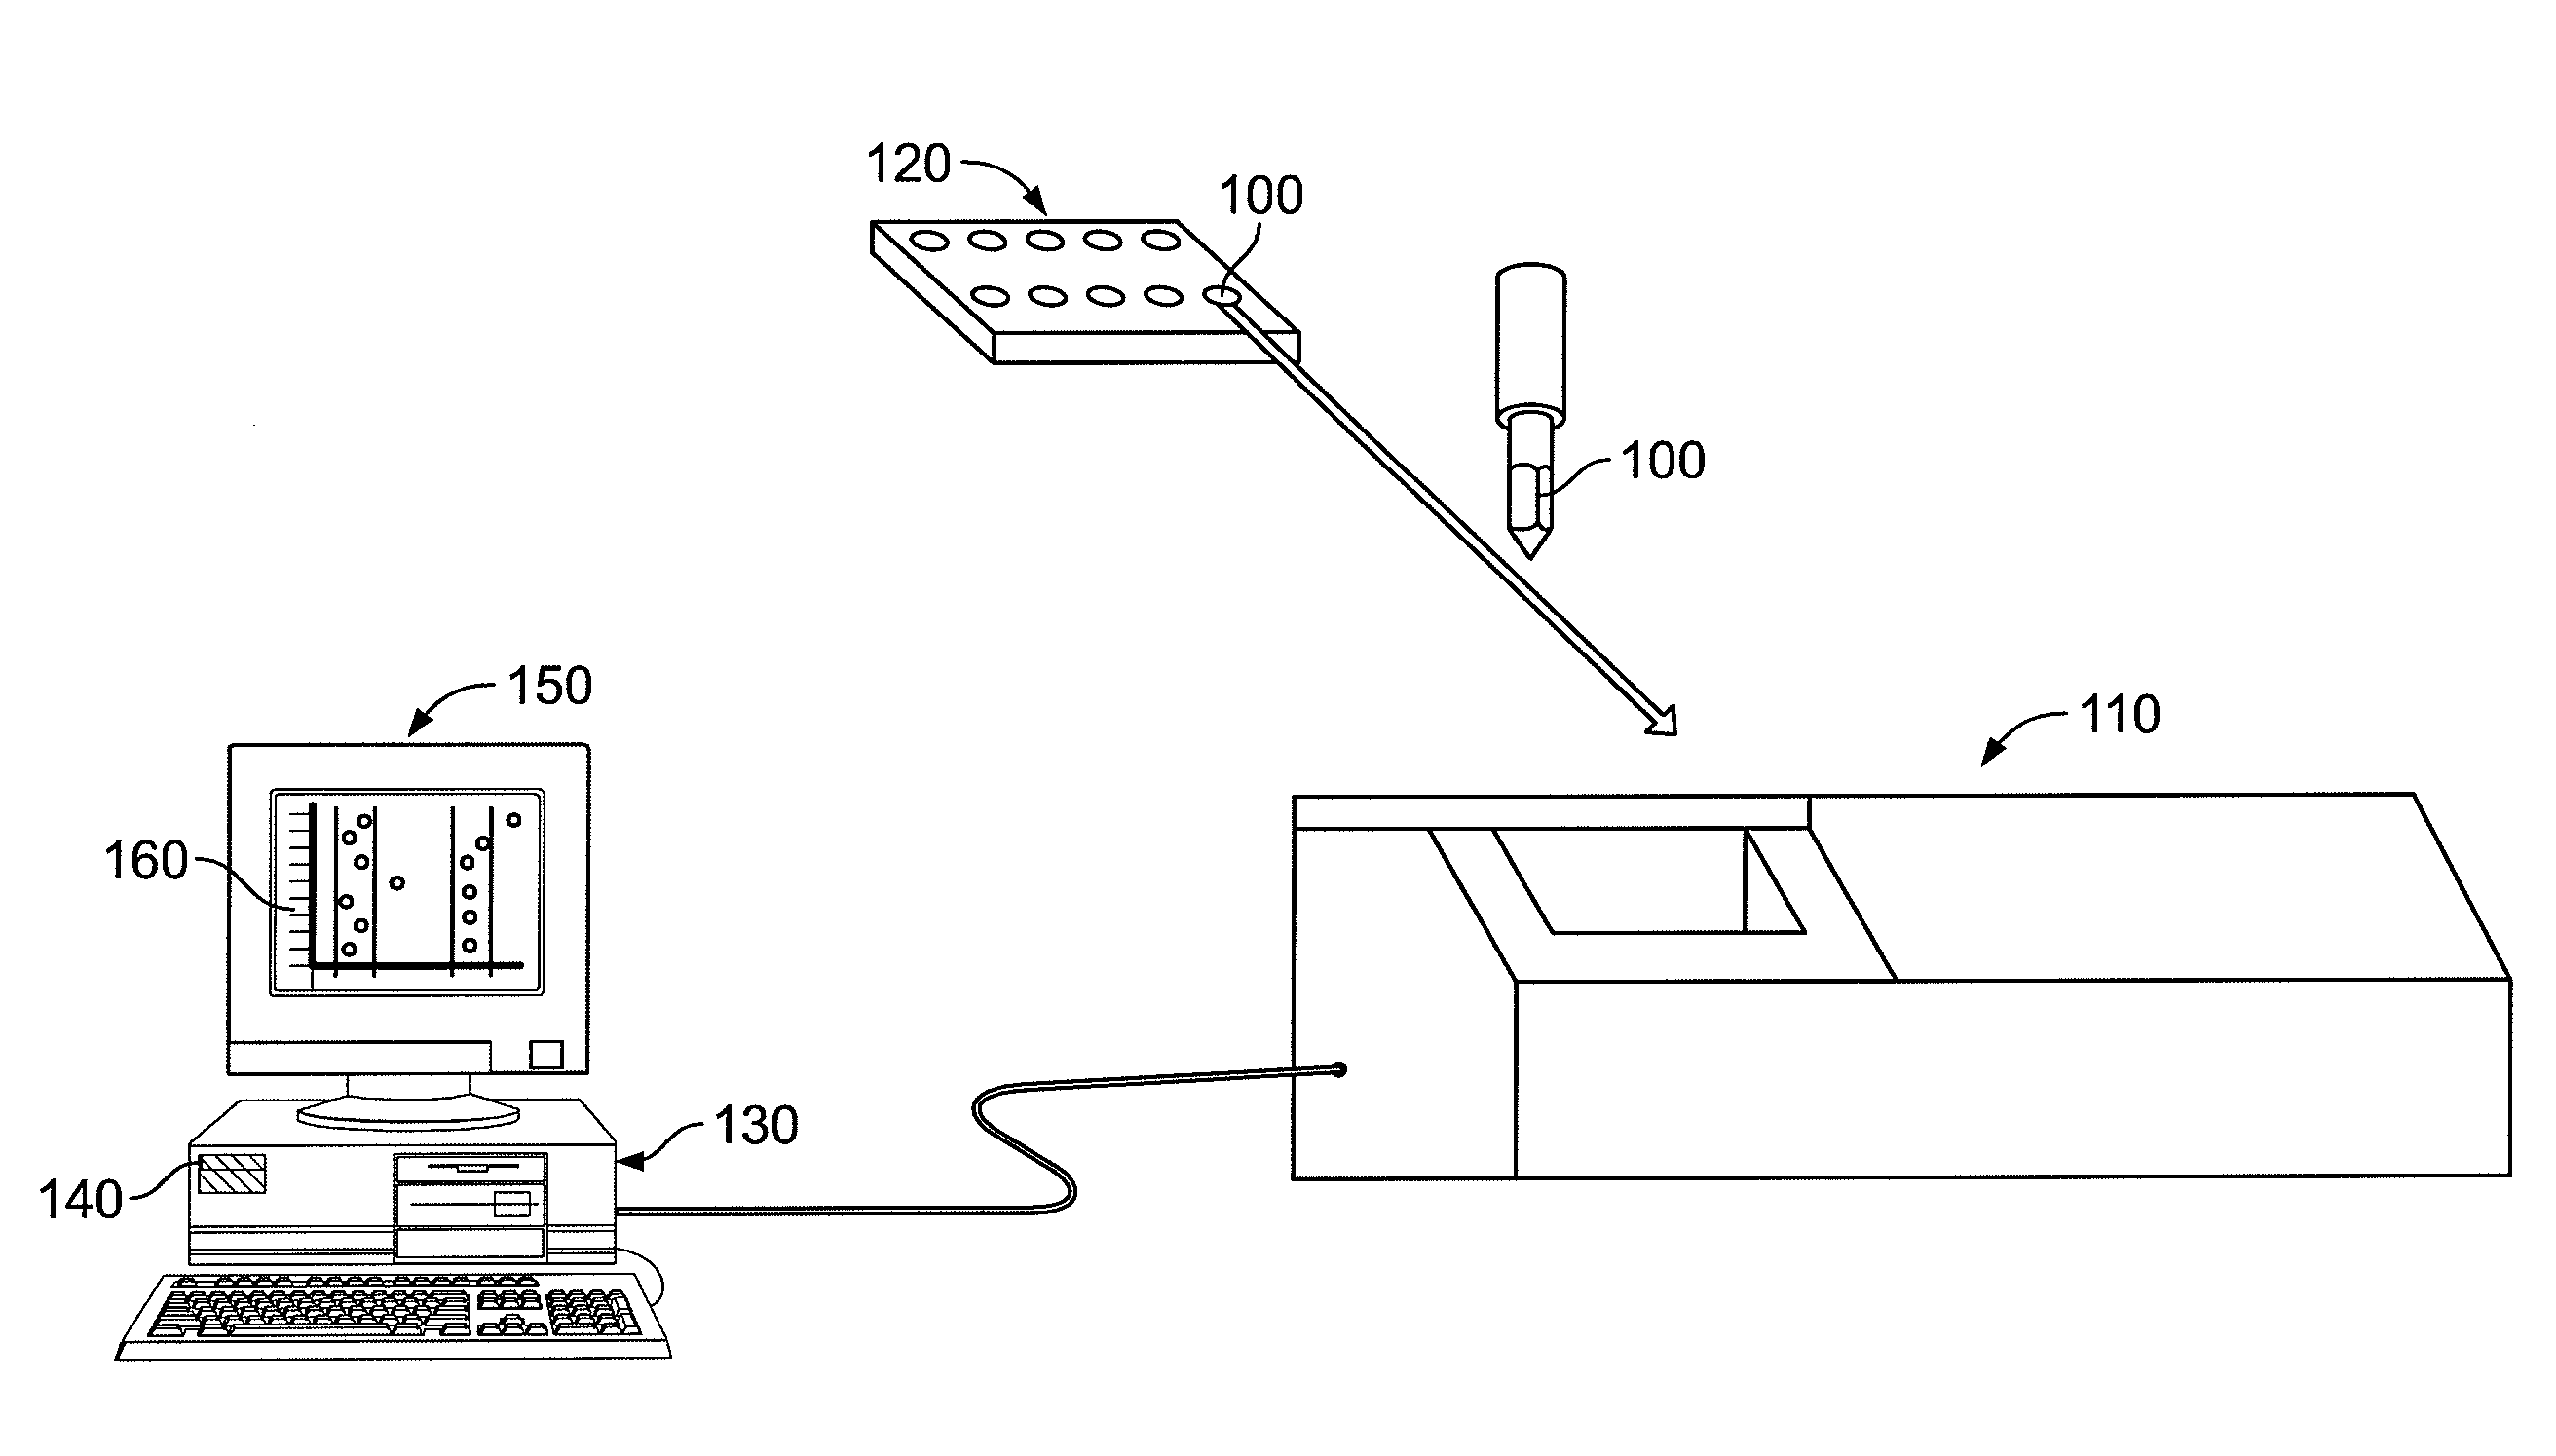
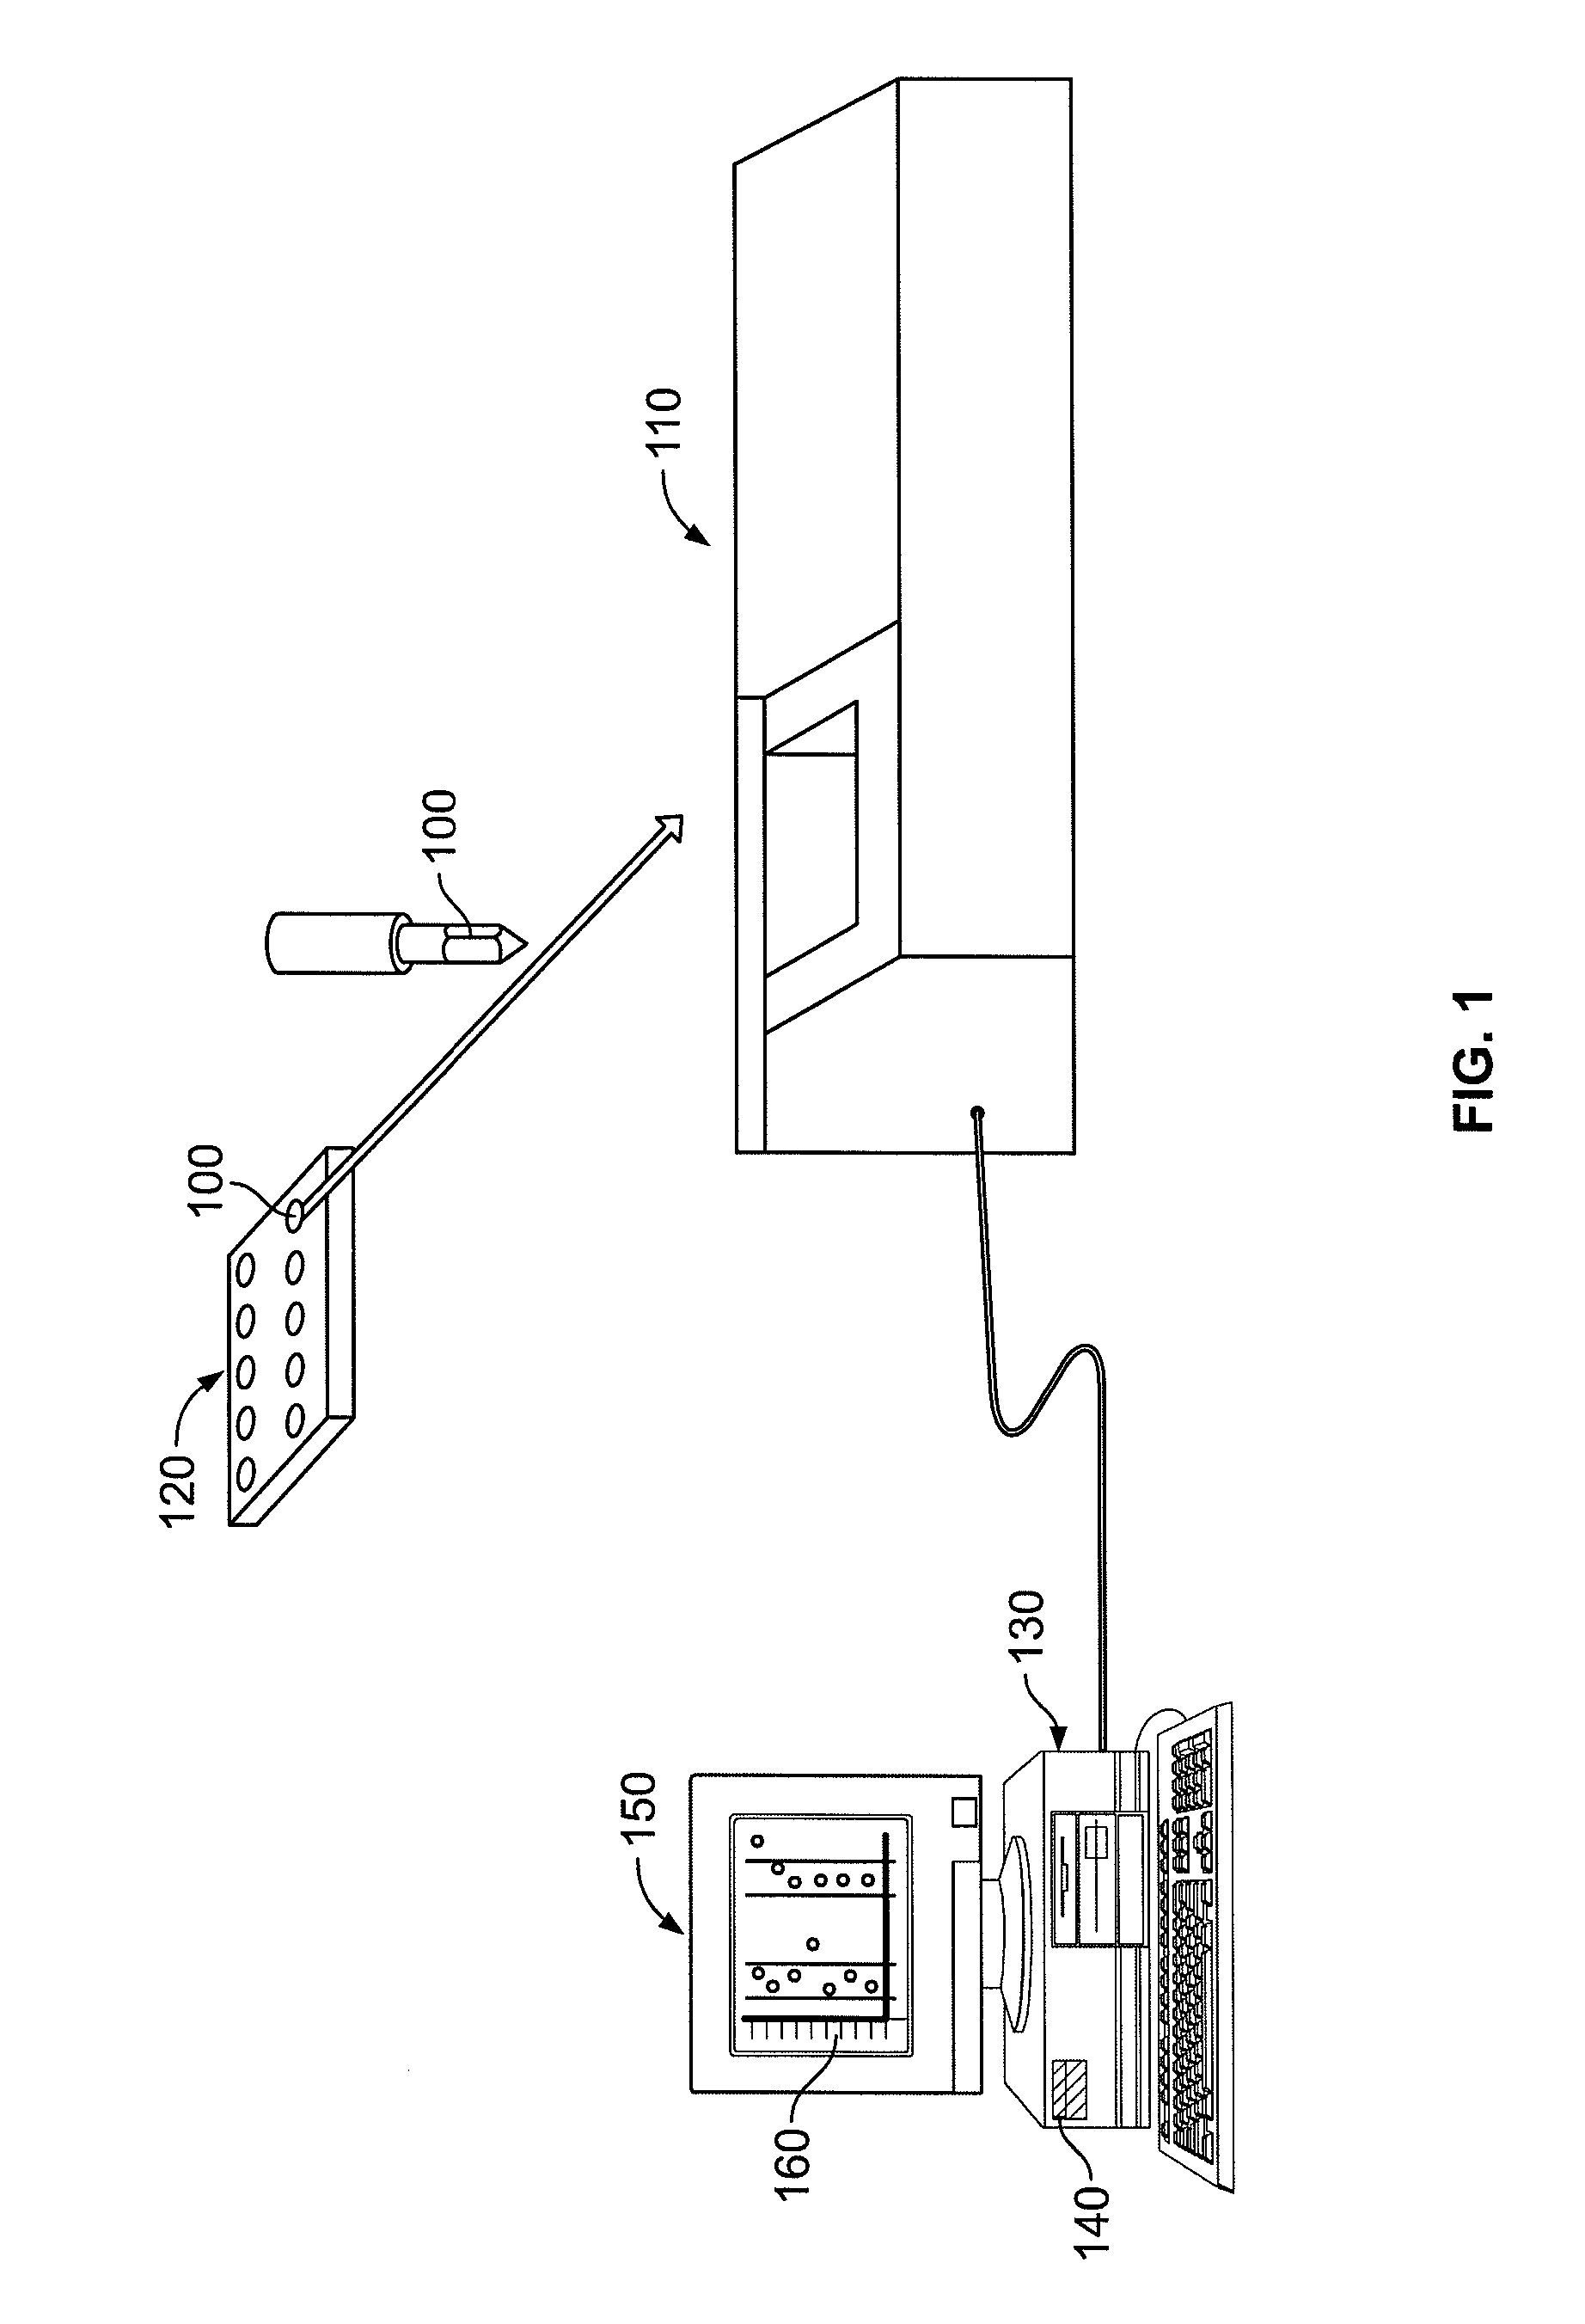
[0030]Though the systems, methods, and computer program products of the present invention are described in conjunction with a mass spectrometer used to analyze metabolomic data, one skilled in the art will appreciate that such description is for exemplary purposes only. More particularly, the systems, methods, and computer program products of the present invention can be adapted to any number of processes that are used to generate complex sets of spectral data across a plurality of biological samples. For example, ...


PUM

PropertyMeasurementUnit
relative concentrationaaaaaaaaaa
spectraaaaaaaaaaa
spectrumaaaaaaaaaa

Abstract

A system is provided for analyzing metabolomics data received from an analytical device across a group of samples. The system automatically receives a data matrix corresponding to each of the samples, wherein the data matrix includes rows corresponding to each of the samples and columns corresponding to a group of ions present in the respective samples. A processor is provided for determining a characteristic value corresponding to at least one of a group of components present in the samples, wherein the components are made up of at least a portion of the group of ions, using at least one of a correlation function and a factorization function. A user interface is in communication with the processor for displaying a visual indication of the characteristic value such that a user may receive a visual indication of the types of components present in the samples.

Description

CROSS-REFERENCE TO RELATED APPLICATIONS[0001]This application claims priority from U.S. Provisional Application No. 60 / 784,296, filed on Mar. 21, 2006, which is hereby incorporated by reference herein in its entirety.BACKGROUND OF THE INVENTION[0002]1. Field of the Invention[0003]The present invention relates to the use of non-negative factorization functions and / or correlation functions to determine a characteristic value corresponding to one or more components (such as, for example, metabolites) or other compounds present in a plurality of samples and to use the characteristic value to identify and / or quantify individual components or other components that may be present in the samples.[0004]2. Description of Related Art[0005]The detection of subtle chemical cues in a sample to reveal the presence and corresponding relative quantity of selected components (such as certain small molecules, therapeutic agents, xenobiotics, metabolites, and other substances) has long been a goal of r...

Claims


Application Information

Patent Timeline
Patent Type & Authority Patents(United States)
IPC IPC(8): G01N31/00G16B45/00
CPCG01N30/8675G06K9/624G06F19/703H01J49/0036G06F19/708G16H10/40G16C20/20G16C20/80G06F18/2134
Inventor YOUNG, SIDNEY STANLEYBARRETT, JR., THOMAS HENRYBEECHER, CHRISTOPHER WILLIAM
Owner METABOLON
Why Eureka
Try Eureka