Method for using a graphical debugging tool

Inactive Publication Date: 2010-08-10
THE MATHWORKS INC
View PDF8 Cites 97 Cited by
  • Summary
  • Abstract
  • Description
  • Claims
  • Application Information

AI Technical Summary

Benefits of technology

[0015]The illustrative embodiment of the present invention provides detailed execution information in a graphical modeling and execution environment by providing debugging information in a model view. The debugger displays all methods invoked during simulation and allows the user to have access to these methods; i.e., the user is able to interrupt execution before or after any method executes and is able to access any block data at these stops. In addition information related to solvers used in simulation of the model and profiling information are displayed and made available to the user. The user is also able to inject numerical data into the model to test different scenarios and as a result, alter the execution of the model. Additionally, compiled information may be superimposed onto the graphical model view of the bloc

Problems solved by technology

Complexity and a greater level of detail increases the probability that unexpected and undesired behavior is introduced into the model either through modeling error or by the inappropriate use of the simulation/execution environment.
In some cases, piecing together separately designed, functionally correct parts of a model results in aberrant behavior of the combination.
Another example of unexpected and undesired model behavior is a severe slow-down in continuous time simulation due to the repeated use of very small step sizes that may be a result of incorrect or inefficient modeling of an engineered system.
Unfortunately, this level of detail is not available as its display and accessibility introduces significant execution overhead.
Instead, the model can be run in a distinct ‘debug’ mode, where the additional information is exposed, but at the cost of execution speed.
These subsystems can be designed independently, but when connected, unexpected behavior may result.
This is a major restriction in debugging a model's execution since the unexpected behavior may not be observable at a block's output method.
Instead, the behavior may be related to a non-virtual subsystem method or one of the other types of methods, in which case displaying data at a block's output method is not helpful to the user.
For example, the sort of problem illustrated

Method used


Image

  • Method for using a graphical debugging tool
  • Method for using a graphical debugging tool
  • Method for using a graphical debugging tool

Examples


Embodiment Construction

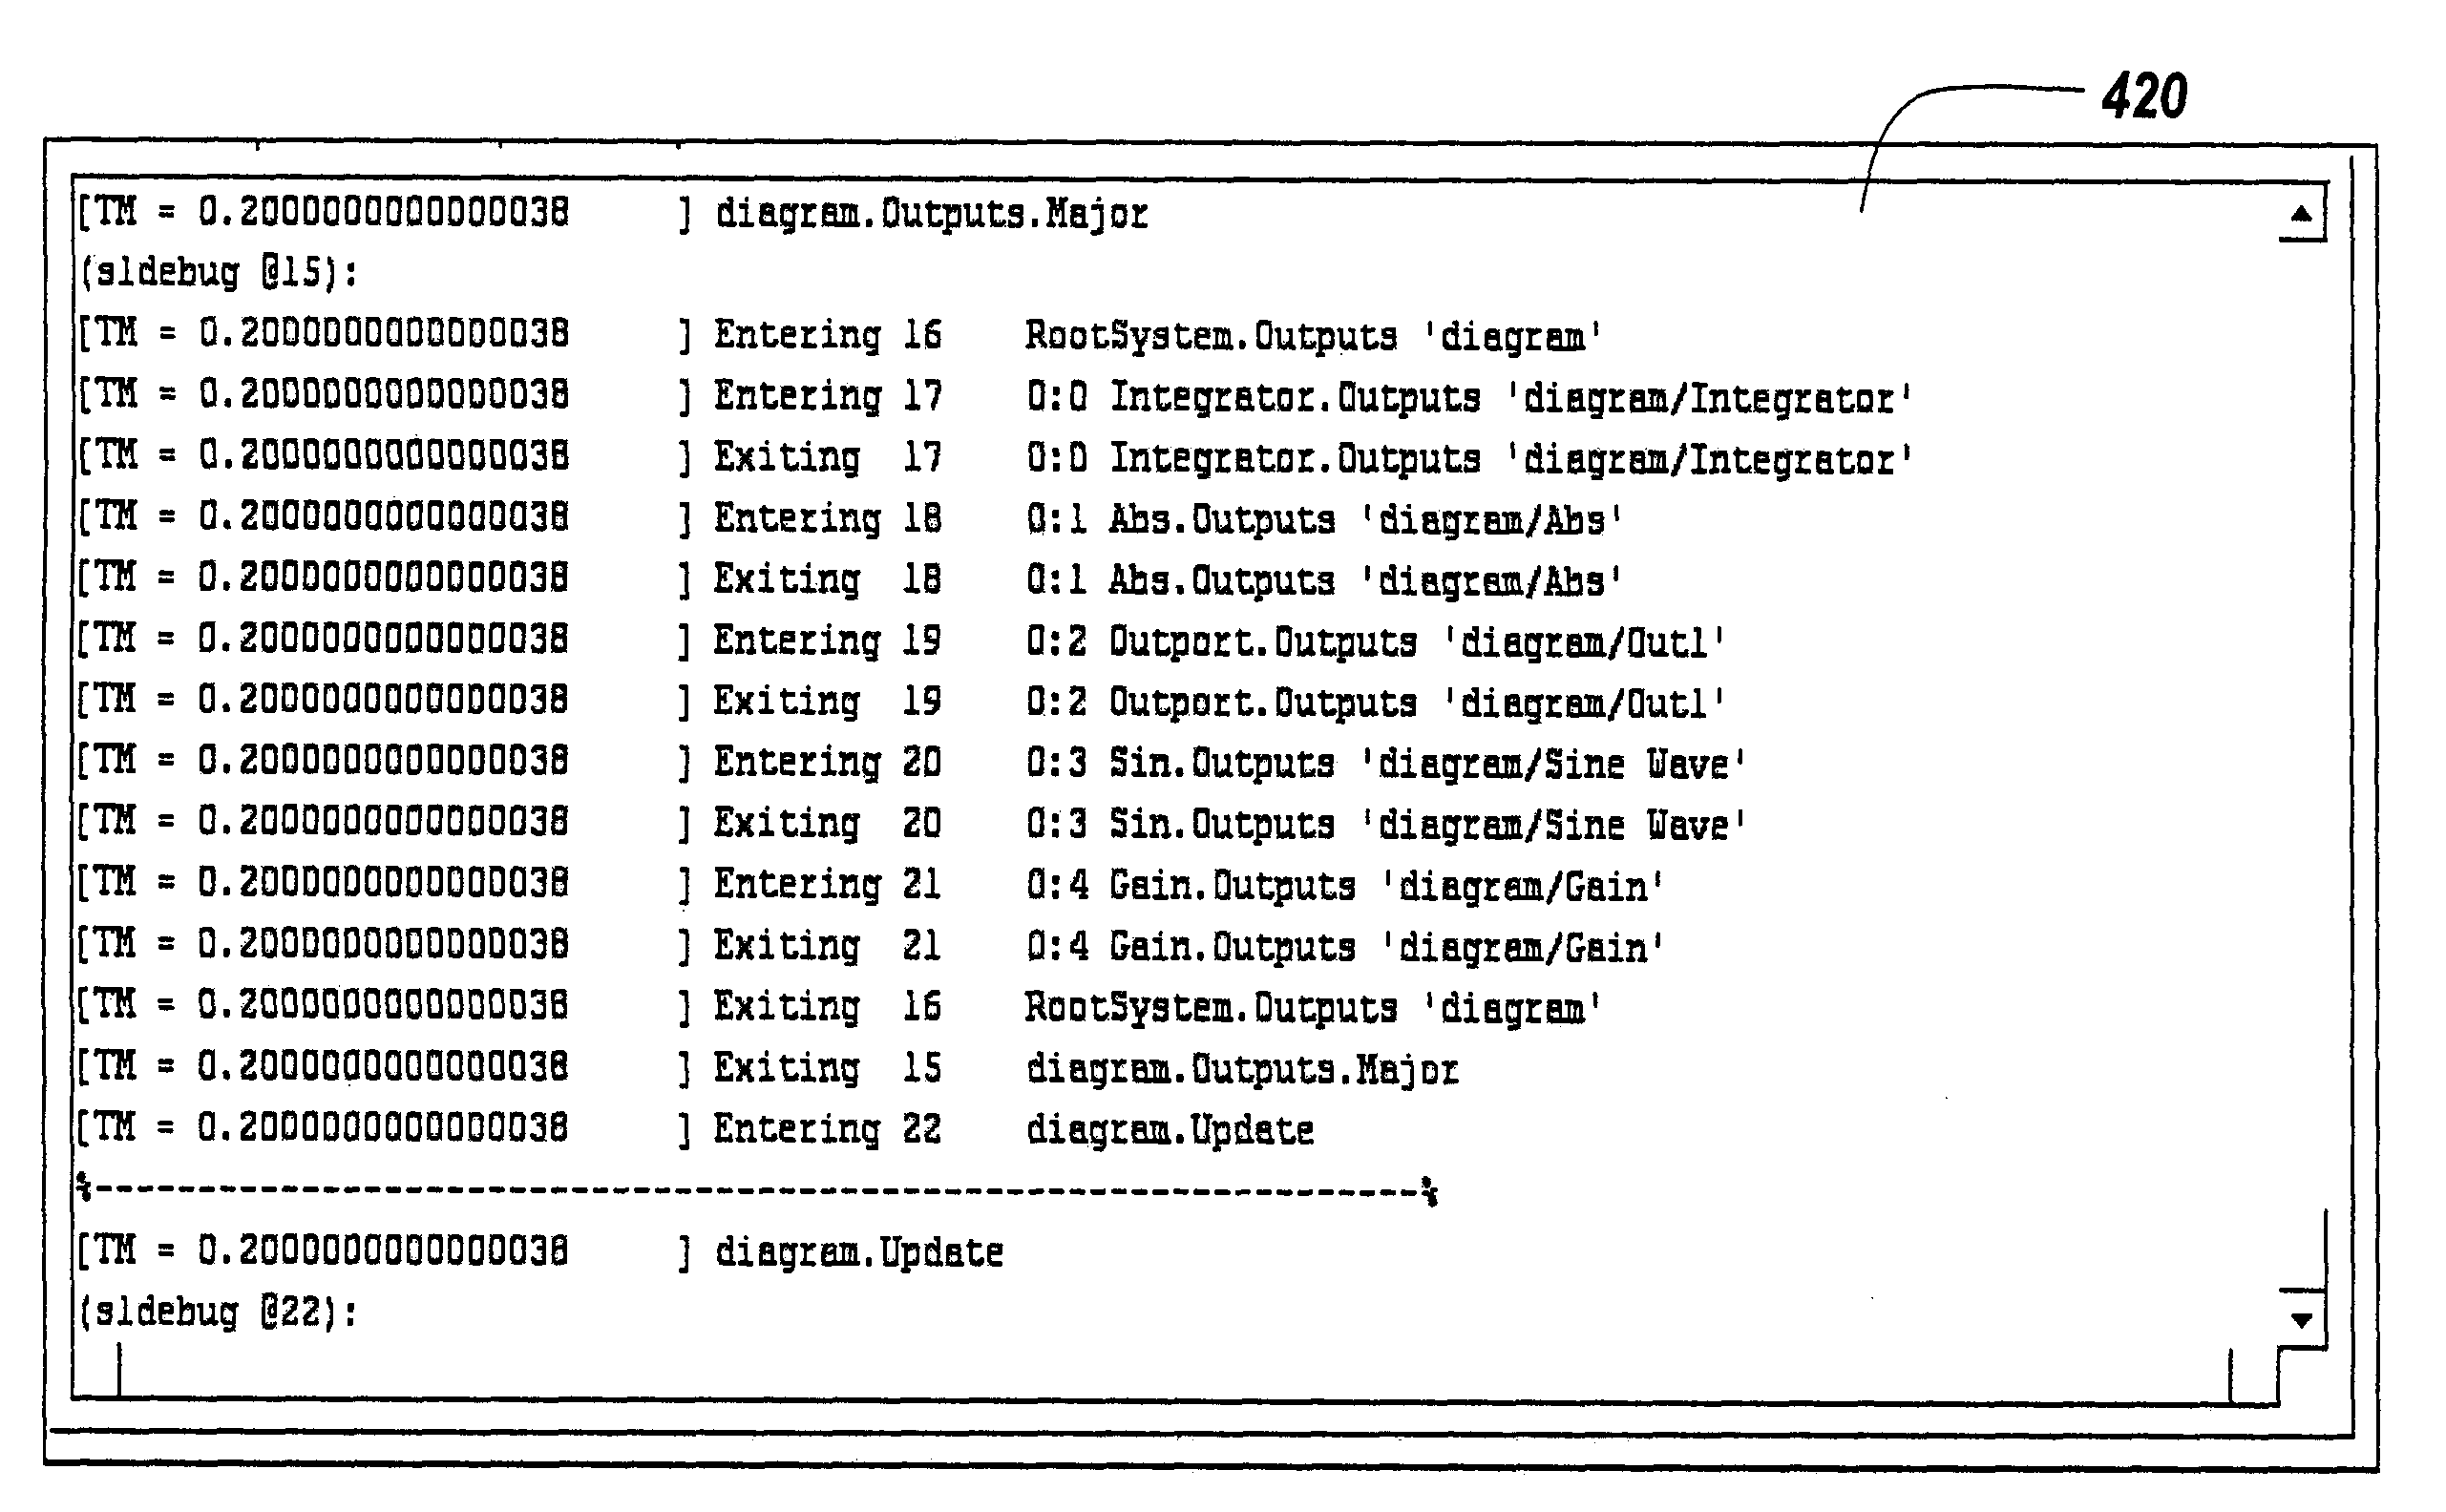
[0056]The illustrative embodiment of the present invention allows a user to view debugging information in the same window as the graphical view of the model being simulated. Debugging data is associated with relevant parts of the model displayed in the graphical view. A separate execution list view shows the methods called during the simulation of the block diagram in the current time step up until the current point in simulation. User-set breakpoints and conditional breakpoints may be set in both the model view and the execution list view. The debugging tool may be implemented by using it in conjunction with a graphical design environment such as a block diagram environment, for example, Simulink™ from The MathWorks, Inc. of Natick, Mass.

[0057]For ease of explanation, references and examples herein discussing the modeling and execution environment are made to block diagrams being processed in a MATLAB™ and Simulink™-based environment. It should be understood however, that the prese...


PUM


Abstract

A system and method of exposing debugging information in a graphical modeling and execution environment is disclosed. The present invention allows a user to view debugging information in the same window as the graphical view of the model being executed. Debugging data is associated with relevant components of the model displayed in the graphical view. A separate execution list view shows the methods called during the execution of the block diagram in the current time step up until the current point in execution. User-set breakpoints and conditional breakpoints may be set in both the model view and the execution list view. Values may be obtained for all of the displayed methods. The debugging tool may be implemented by using it in conjunction with a graphical modeling and execution environment, such as a block diagram environment or state diagram environment.

Description

FIELD OF THE INVENTION[0001]The illustrative embodiment of the present invention relates generally to the debugging of executed models, and more particularly to graphically debugging models in an interactive manner in a modeling and execution environment.RELATED APPLICATION[0002]The present application is related to a pending United States Application filed herewith entitled “A System and Method for Using a Graphical Debugging Tool in a Modeling and Execution Environment”.BACKGROUND[0003]Current design processes for engineered systems have led to the use of sophisticated methods to simulate the behavior of increasingly detailed models. Complexity and a greater level of detail increases the probability that unexpected and undesired behavior is introduced into the model either through modeling error or by the inappropriate use of the simulation / execution environment. For example, large models rely on compositionality principles to manage their size. These models are frequently designe...

Claims


Application Information

Patent Timeline
IPC IPC(8): G06F7/60G06F17/10G06F9/44
CPCG06F8/34G06F8/35G06F11/3664G06F17/5009G06F30/20Y10S715/967
Inventor YUNT, MEHMETYEDDANAPUDI, MURALISINGH, SANJAICIOLFI, JOHN
Owner THE MATHWORKS INC
Why Eureka
Try Eureka