
Methods of scaling data used to construct biosensor algorithms as well as devices, apparatuses and systems incorporating the same

a biosensor and algorithm technology, applied in the field of mathematical and medical science, can solve problems such as deviation from the “true” glucose concentration, and achieve the effect of reducing the impact of confounding variables

Active Publication Date: 2016-07-19
ROCHE DIABETES CARE INC
View PDF19 Cites 1 Cited by
  • Summary
  • Abstract
  • Description
  • Claims
  • Application Information

AI Technical Summary

Benefits of technology

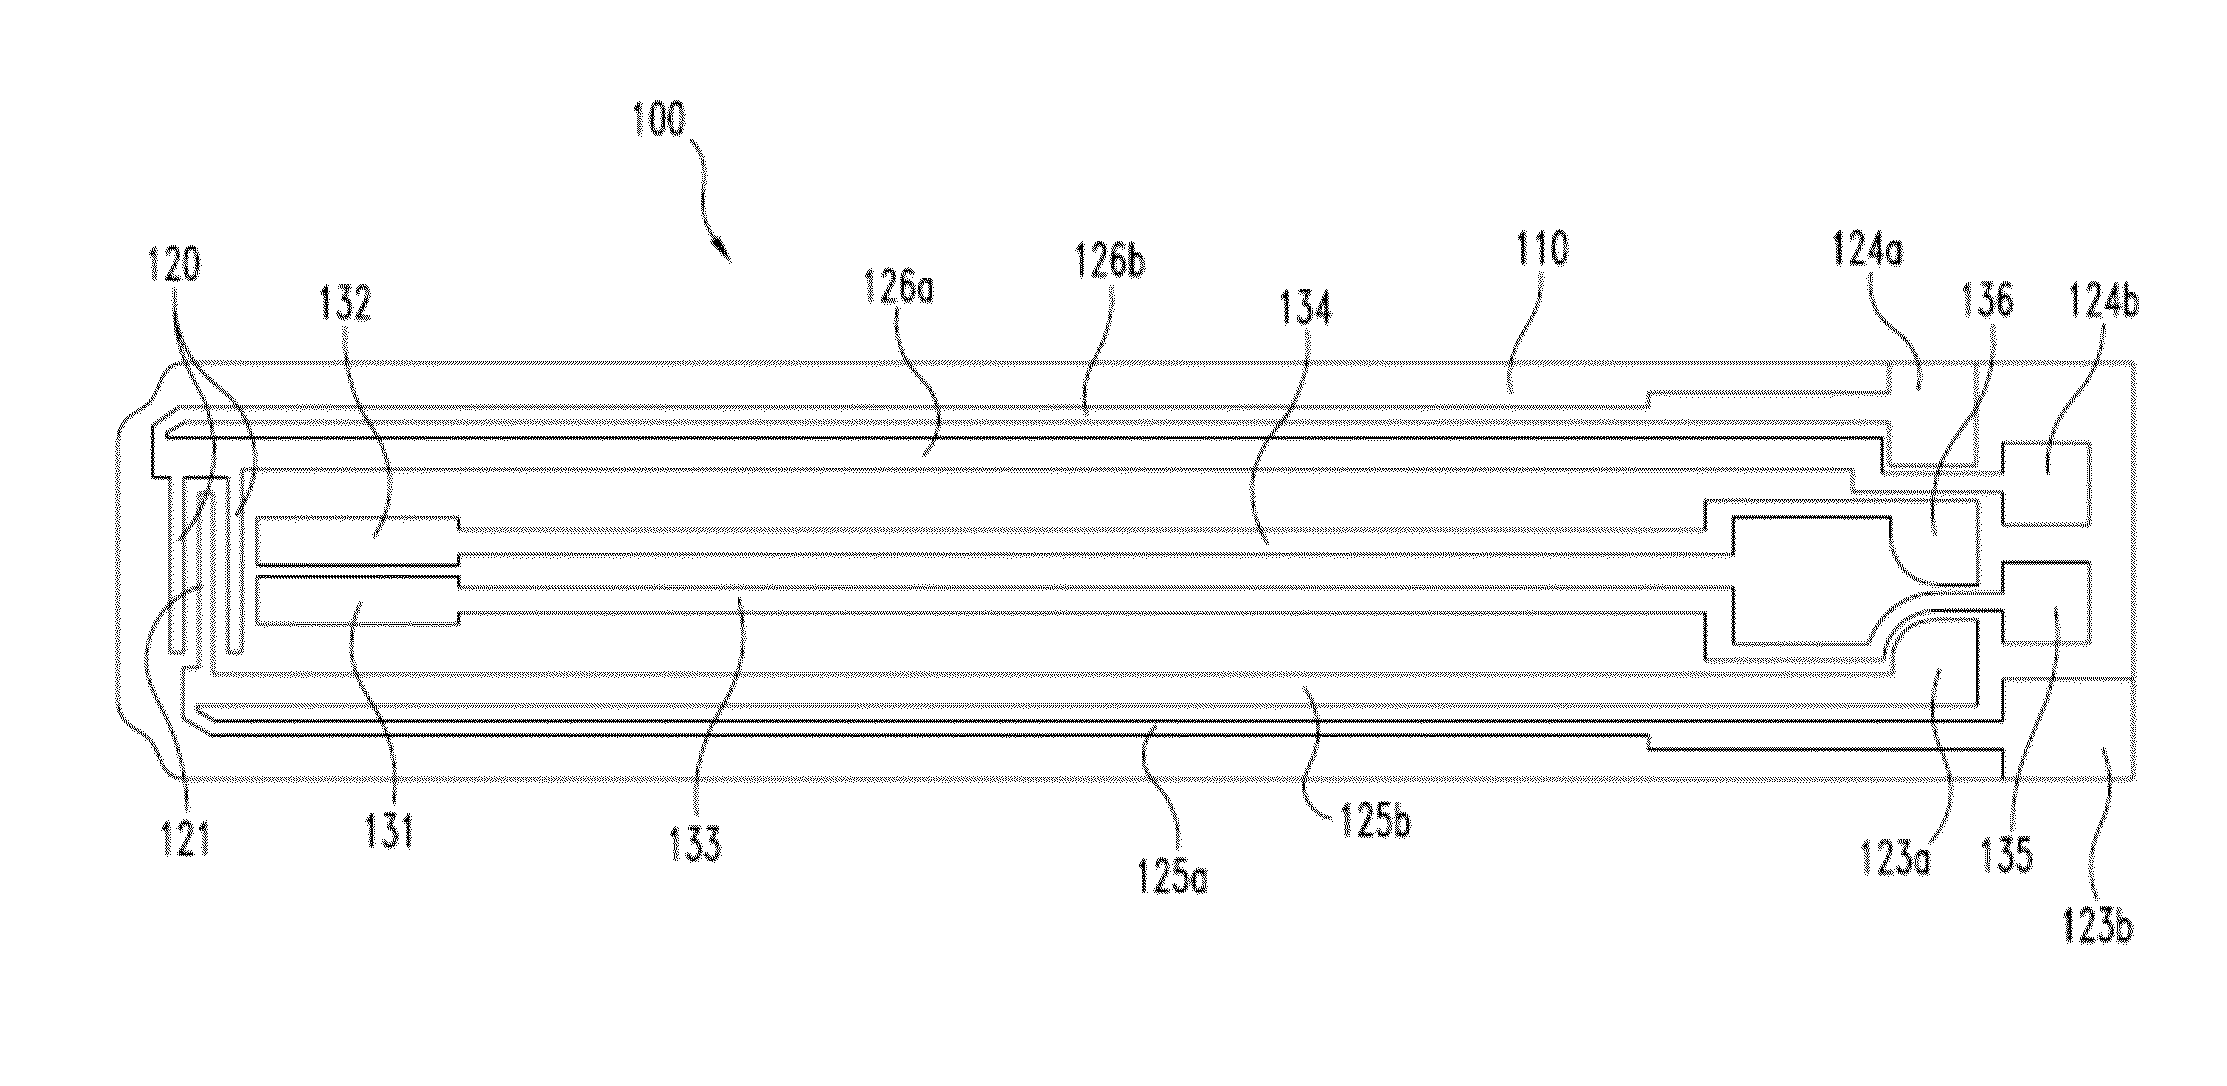
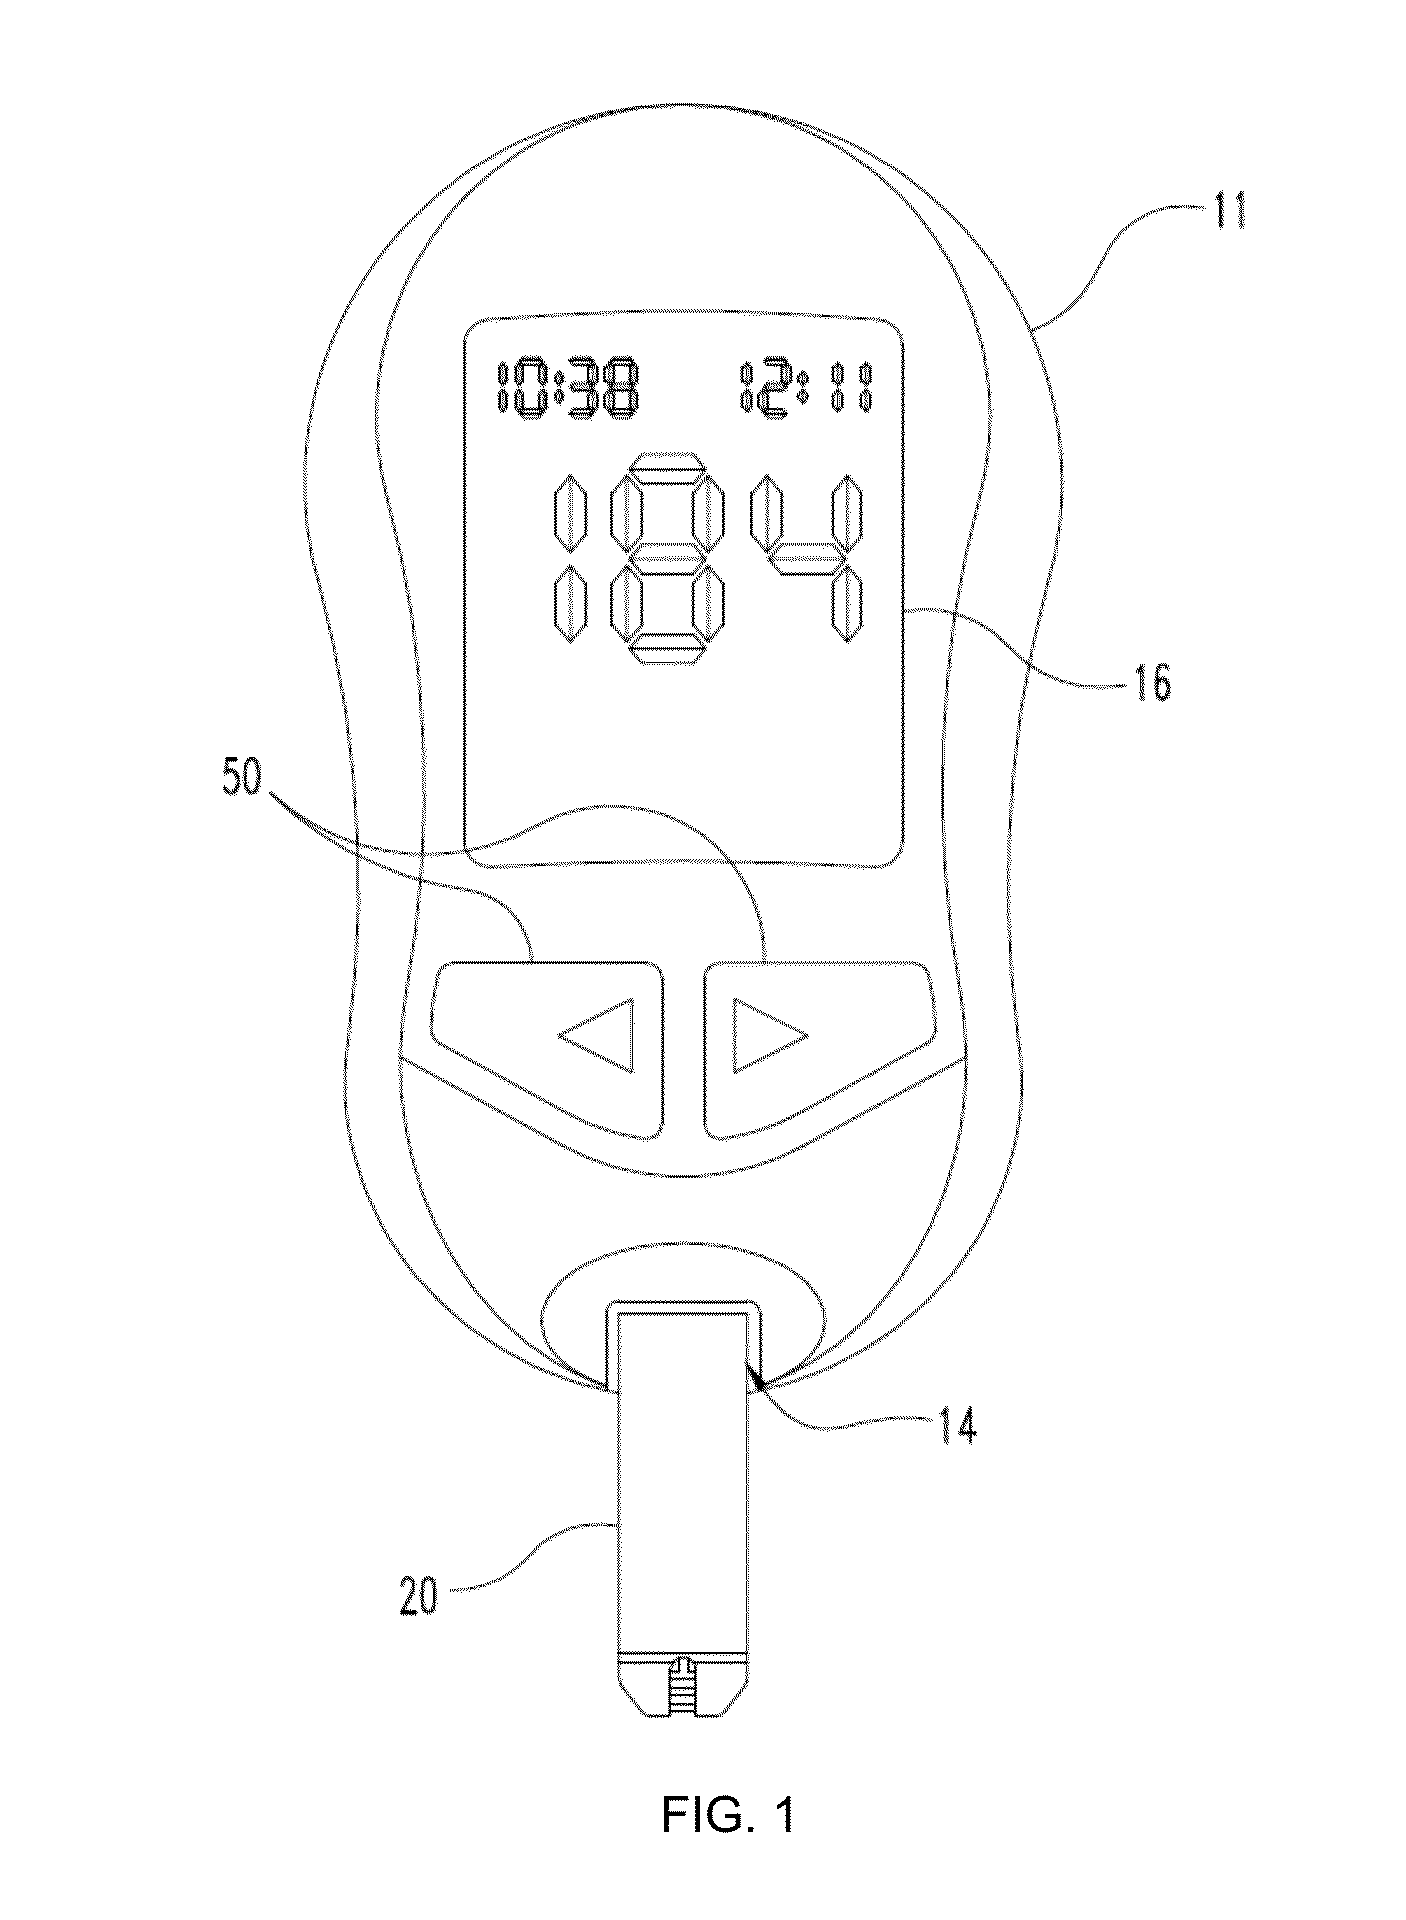
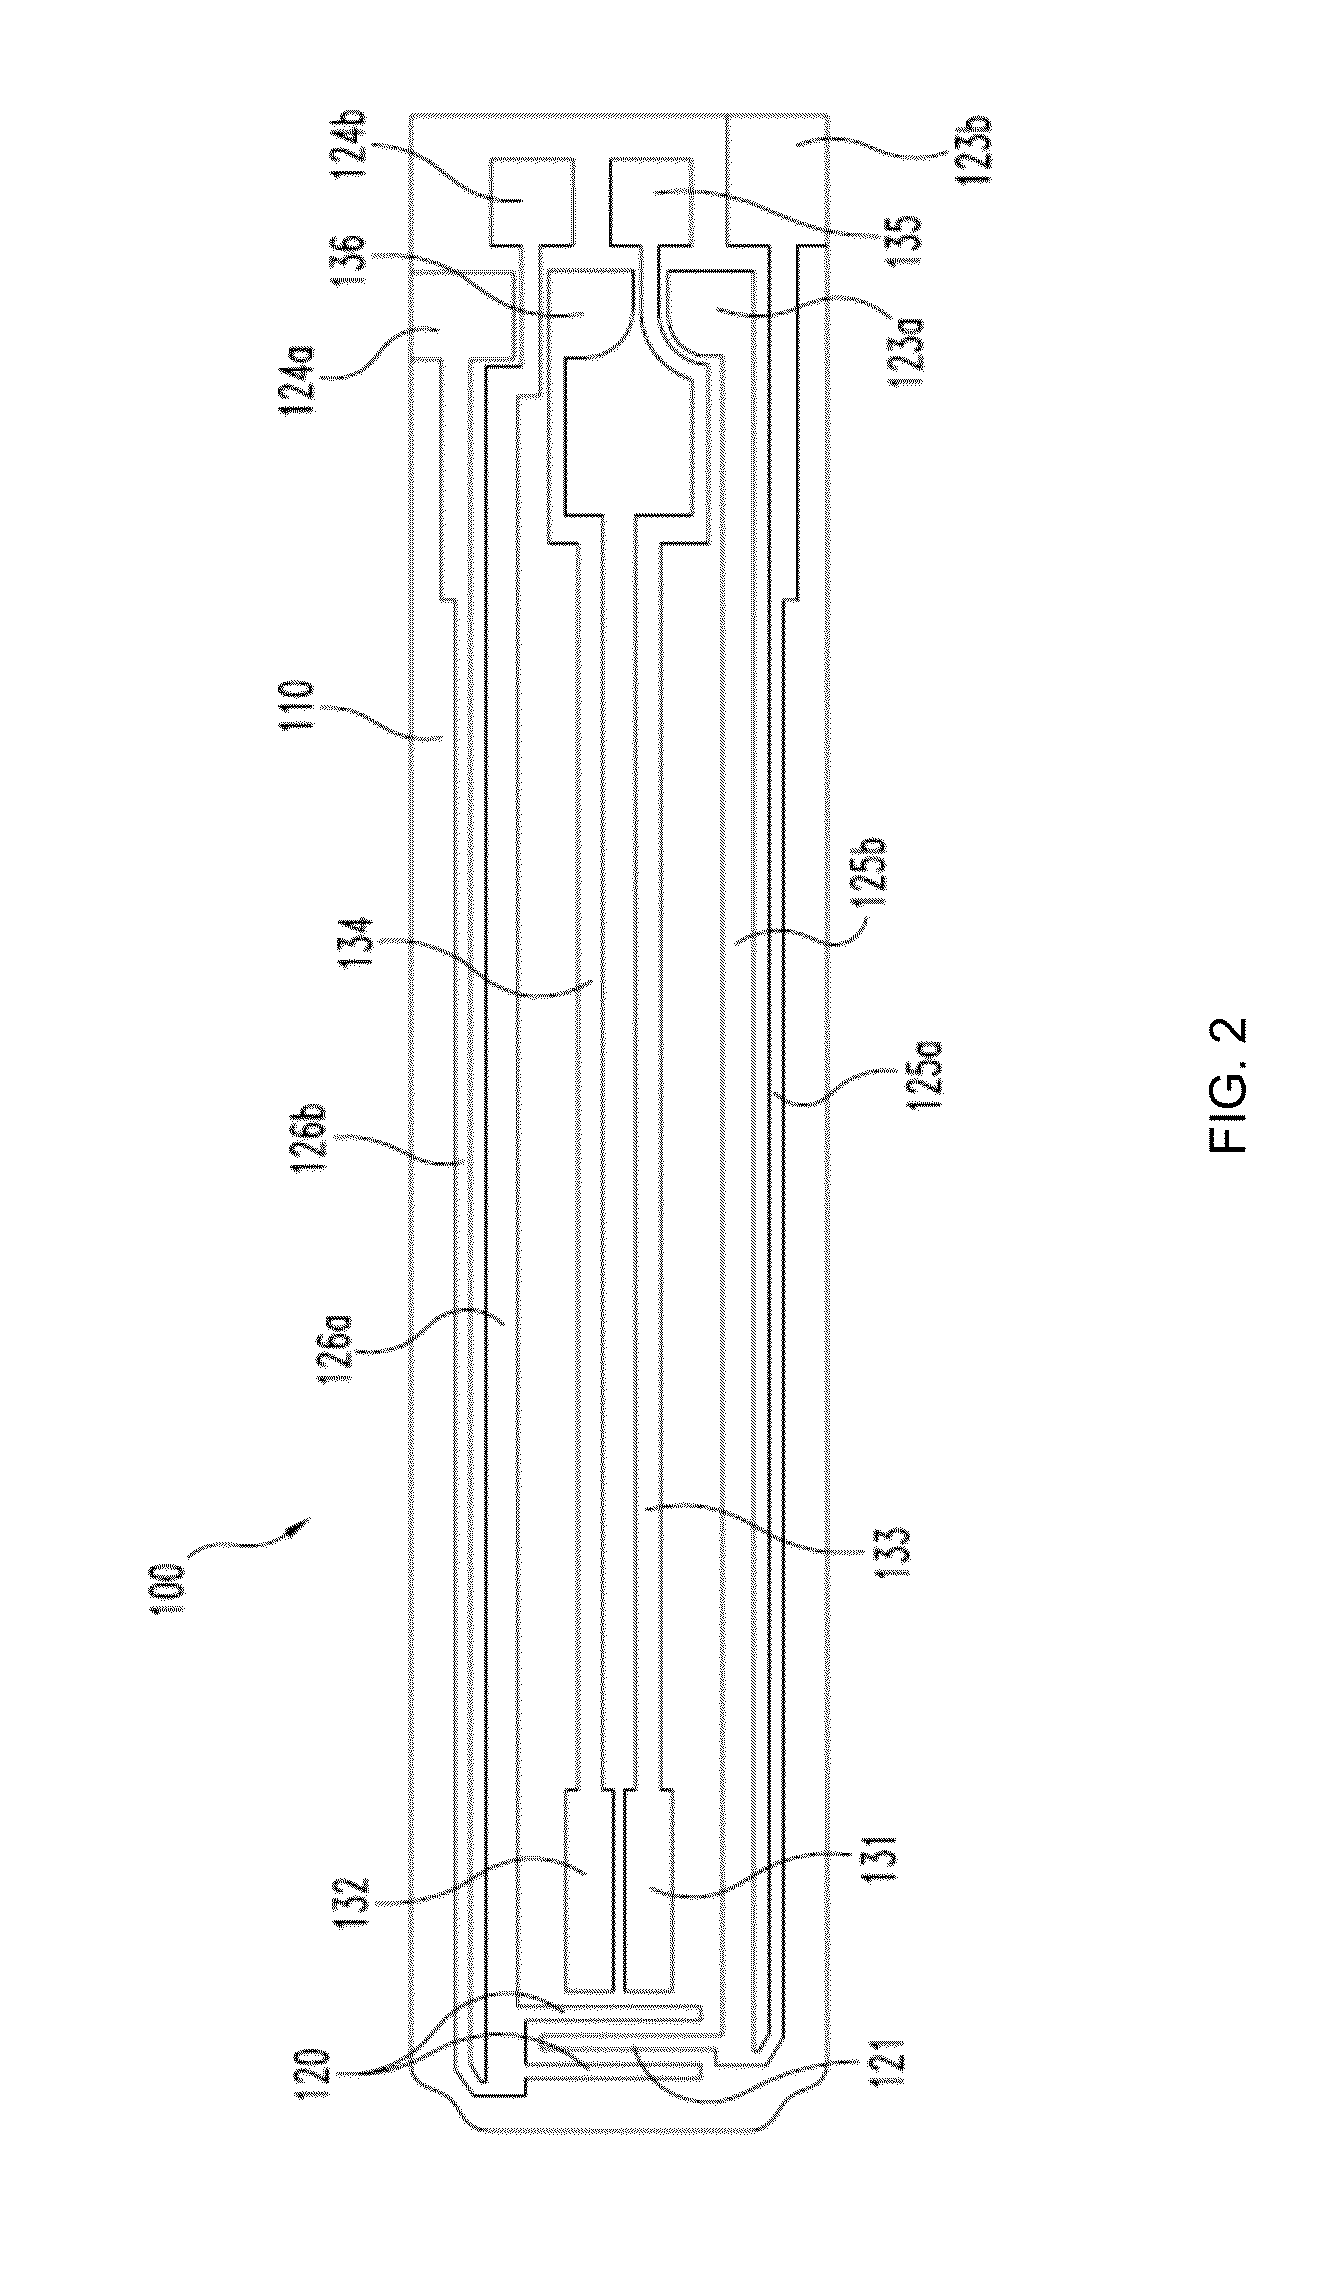
The patent describes methods for correcting or compensating for the effects of certain confounding variables in measuring the concentration of an analyte in a fluid sample. This is done by using information derived from alternating current (AC) responses to scale data from higher amplitude responses (such as DC measurements) in a manner that reduces the impact of confounding variables before using algorithms that provide an analyte concentration. These methods provide advantages over known methods of measuring analyte concentrations in bodily fluids. Additionally, the patent provides scaling methods to compensate for low or high Hct during a body fluid analysis for an analyte of interest. These methods involve applying an AC block in connection with at least one DC block, measuring AC and DC current responses, calculating a solution resistance (Rsolution) from AC block signals and current responses, and multiplying DC current responses by Rsolution to obtain a compensated voltage drop or compensated current that minimizes the influence of Hct or temperature on the analyte concentration.

Problems solved by technology

These interferents, or confounding variables, can cause an increase or decrease in the observed magnitude of the DC current that is proportional to an analyte such as glucose, thereby causing a deviation from the “true” glucose concentration.

Method used


Image

  • Methods of scaling data used to construct biosensor algorithms as well as devices, apparatuses and systems incorporating the same
  • Methods of scaling data used to construct biosensor algorithms as well as devices, apparatuses and systems incorporating the same
  • Methods of scaling data used to construct biosensor algorithms as well as devices, apparatuses and systems incorporating the same

Examples


example 1

The Rsolution Scaling Method

[0110]This example shows results of the first exemplary scaling method as shown in FIGS. 5A-C, which depict Nyquist plots for a large dataset of glycolized venous blood samples produced with an experimental design in which glucose, Hct and temperature were systematically co-varied. The dataset also contained spiked plasma samples at three different salt levels. These results are from a large dataset of glycolized venous blood samples with co-varied glucose, Hct and temperature levels combined with nominal spiked plasma samples containing different levels of salt.

[0111]FIG. 5A shows complex AC responses in spectral order and represents low-to-high Hct levels. One set of responses corresponds to the plasma samples with different salt concentrations. Using the methods described above and shown in FIG. 4, an estimate of Rsolution was obtained for each sample and then subtracted from each of the observed values of real impedance.

[0112]The Rsolution compensated...

example 2

The Factor Scaling Method

[0117]A second exemplary scaling method is based upon a direct scaling of DC current measurements using the admittance at 20 kHz. FIG. 7 shows a relationship between a given DC current value and the measured admittance at 20 kHz (Y20). As described above, the measured Y20 is dependent upon both Hct level and temperature. Due to the impact of Hct and temperature, a given DC magnitude can correspond to more than one glucose level. The second exemplary scaling method therefore is based upon computing a new angle, θ, formed between a selected DC current value and the corresponding Y20 for the same sample. The value of θ is calculated according to the following equation:

θ=arctan(DC / Y20).

[0118]The second exemplary scaling method produces a situation in which θ is “orthogonal” to the Y20, as seen in FIG. 8, thereby seeking to minimize the impacts of Hct and temperature in the new variable. This impact is minimized because the surface generated by θ, Y20, and glucos...

example 3

The “Power” Scaling Method

[0119]A third scaling method is based upon the scaling of a DC current value by a Y20 raised to an optimized power, where the power term ranges typically from 0 to 10. This scaling method can be performed in accordance with the following equation:

scaled DC=DC / Y20optimized power.

[0120]The rationale behind this approach is that both DC and Y20 are dependent on Hct and temperature, while only DC is dependent on glucose concentration in the test sample. By scaling DC current with Y20, adjusted with certain power, Hct- and temperature-dependence can thus be removed from DC while glucose dependence is still preserved.

[0121]The power term is optimized through Pearson correlation score as shown in FIGS. 9-10. The power has been iterated between 0 and 10. DC3533 (the DC current measured at 3.533 seconds after sample sufficiency) was used in demonstrating this method. At each chosen power, a Pearson correlation was calculated between the scaled DC current and one of ...


PUM

PropertyMeasurementUnit
frequenciesaaaaaaaaaa

Abstract

Methods are disclosed for scaling body fluid analysis data to correct and / or compensate for confounding variables such as hematocrit (Hct), temperature, variations in electrode conductivity or combinations thereof before providing an analyte concentration. The scaling methods utilize current response data obtained from an AC block applied prior to a DC block to minimize the impact of such confounding variables upon the observed DC current response before creating descriptors or algorithms. The scaling methods therefore compensate the measured DC current by using data from the AC block made on the same sample. Also disclosed are devices, apparatuses and systems incorporating the various scaling methods.

Description

CROSS-REFERENCE TO RELATED APPLICATIONS[0001]This patent application is a continuation of Int'l Patent Application No. PCT / EP2014 / 054952 (filed 13 Mar. 2014), which claims priority to and the benefit of U.S. Provisional Patent Application No. 61 / 794,280 (filed 15 Mar. 2013). Each patent application is incorporated herein by reference as if set forth in its entirety.TECHNICAL FIELD[0002]The disclosure relates generally to mathematics and medicine, and more particularly, it relates to methods of scaling body fluid analysis measurement data to correct and / or compensate for confounding variables such as hematocrit (Hct), temperature, raw material variations such as electrode conductivities or a combination thereof before providing an analyte concentration.BACKGROUND[0003]Many analyte measurement systems, such as self-monitoring blood glucose (SMBG) systems, clinical blood glucose monitoring systems and laboratory blood glucose monitoring systems, are based upon an amperometric, coulomet...

Claims


Application Information

Patent Timeline
Patent Type & Authority Patents(United States)
IPC IPC(8): G01N27/327G01N27/10
CPCG01N27/3274G01N27/10G01N27/3273G01N33/66G01N27/06
Inventor BUCK, JR., HARVEY B.CARPENTER, SCOTT E.PAN, ZHENG ZHENGVALVERDE-VENTURA, RENE
Owner ROCHE DIABETES CARE INC
Learn More