Automatic analysis device and analysis method

a technology of automatic analysis and analyzer, which is applied in the direction of material analysis, biochemistry apparatus and processes, instruments, etc., can solve the problems of inaccurate concentration value, inability to obtain correct measurement value, and rapid change of absorbance value, so as to ensure the reliability of measurement data, affect reaction speed, and maintain the performance of the analyzer.

Active Publication Date: 2016-10-25
HITACHI HIGH-TECH CORP
View PDF8 Cites 8 Cited by
  • Summary
  • Abstract
  • Description
  • Claims
  • Application Information

AI Technical Summary

Benefits of technology

[0054]The use of the evaluation method of the present invention allows evaluating not only the control and the standard solution, but also each measurement result of patient specimen with unknown concentration. If the evaluation of the measurement of each specimen is possible, the reliability of the measurement data can be guaranteed based on the data of the control. For a factor in which the abnormality of the analyzer affects the reaction process data, the abnormality can be checked from daily examination data, and this can contribute to the maintenance of the performance of the analyzer.
[0055]As for the influence of stirring, if, for example, the stirring stops, the reaction speed changes, and the curve of the reaction process data also changes. The calculation and monitoring of the change in the reaction process curve in a specimen with known concentration, such as a control specimen and a standard solution, leads to checking of the chronological performance of the stirring mechanism. The automated analyzer can actively notify the analyzer user of the necessity of the maintenance and the replacement of the stirring mechanism. The presence or absence or the level of stirring, for which the evaluation has been vague, can be quantified, and as for the lag time, the reaction process immediately after the stirring after the addition of the second reagent is monitored. As a result, an optimal condition of stirring can be set. Therefore, not only the abnormality of the stirring mechanism can be detected, but also optimal parameters of each item and each reagent can be verified and determined.
[0056]If a reagent is degraded or diluted by wash water in the reagent probe, the reaction speed is affected. According to the present invention, the inactive degree of the reaction can be numerically expressed, and the reaction abnormality can be detected. The reagent performance can be evaluated, the degradation in the reagent by a human error in the daily examination can be detected, and the overlook of output of wrong data can be prevented.

Problems solved by technology

In such cases, the absorbance value rapidly changes, and a correct measurement value cannot be obtained.
If the fluctuation occurs in photometry time points used for the concentration calculation, the concentration value cannot be accurately obtained.

Method used


Image

  • Automatic analysis device and analysis method
  • Automatic analysis device and analysis method
  • Automatic analysis device and analysis method

Examples


first embodiment

[0071]Hereinafter, a first embodiment of the present invention will be described in detail with reference to the drawings. FIG. 5 is a diagram showing a schematic configuration of a biochemical automated analyzer to which the present invention is applied. Reference numeral 1 denotes a sample disc, 2 denotes a reagent disc, 3 denotes a reaction disc, 4 denotes a reaction vessel, 5 denotes a sampling mechanism, 6 denotes a pipetting mechanism, 7 denotes a stirring mechanism, 8 denotes a photometric mechanism, 9 denotes a washing mechanism, 10 denotes a computer (PC), 12 denotes a storage device, 13 denotes a control unit, 14 denotes a piezoelectric element driver, 15 denotes a stirring mechanism controller, 16 denotes sample containers, 17 and 19 denote circular discs, 18 denotes a reagent bottle, 20 denotes a cooling box, 21 denotes a reaction container, 22 denotes a reaction container holder, 23 denotes a drive mechanism, 24 and 27 denote probes, 25 and 28 denote support shafts, 26 ...

second embodiment

[0097]Next, a second embodiment of the present invention will be described in detail with reference to the drawings. As in the first embodiment, FIG. 5 shows the schematic configuration of the biochemical automated analyzer according to the second embodiment. The operations other than the operation of the control unit 13 are the same as in the first embodiment, and detailed description will not be repeated.

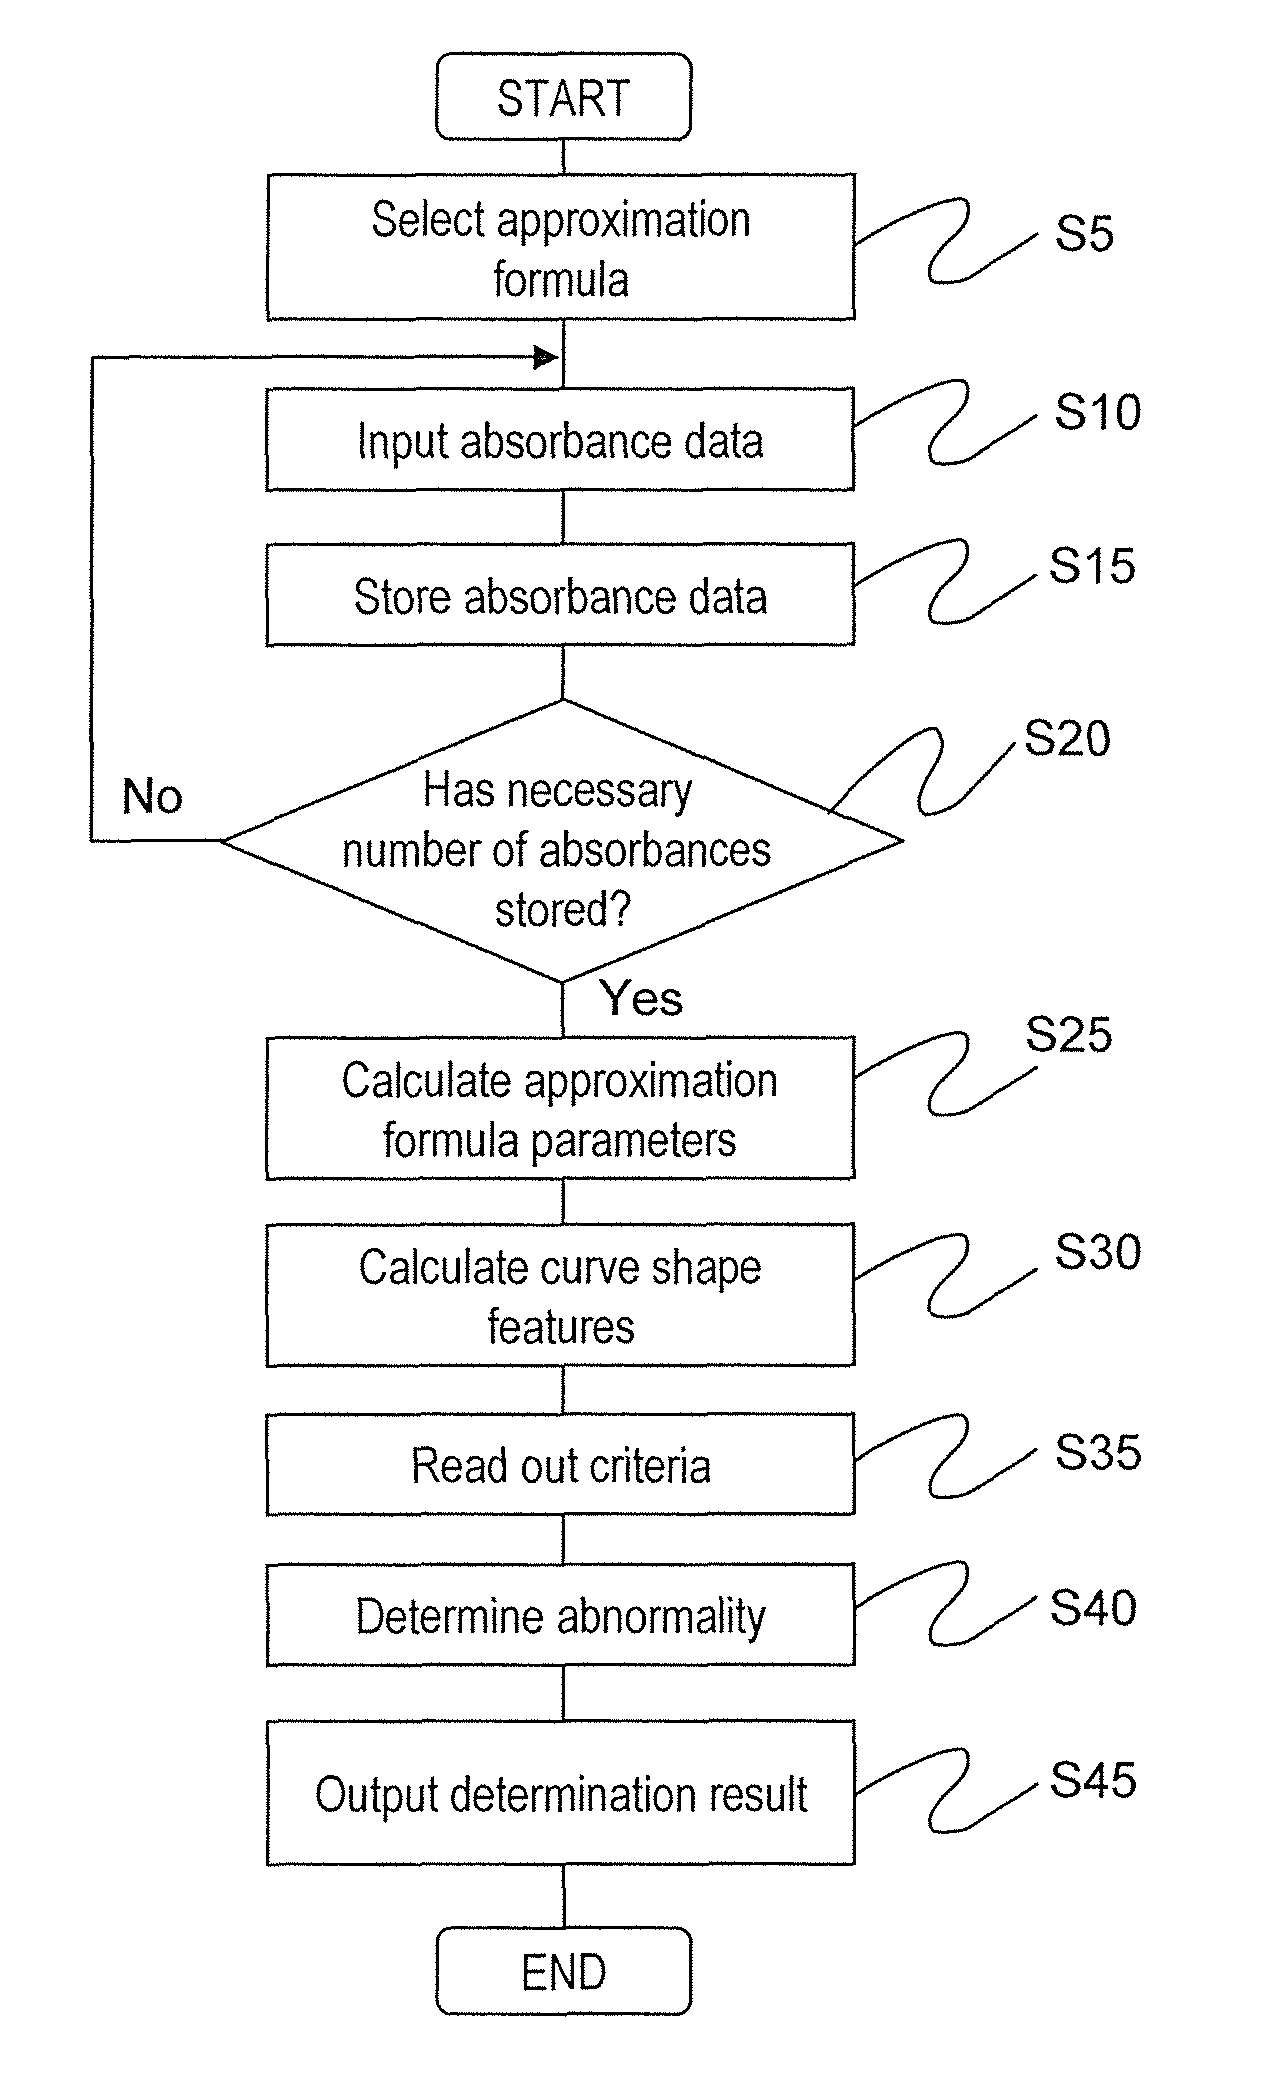
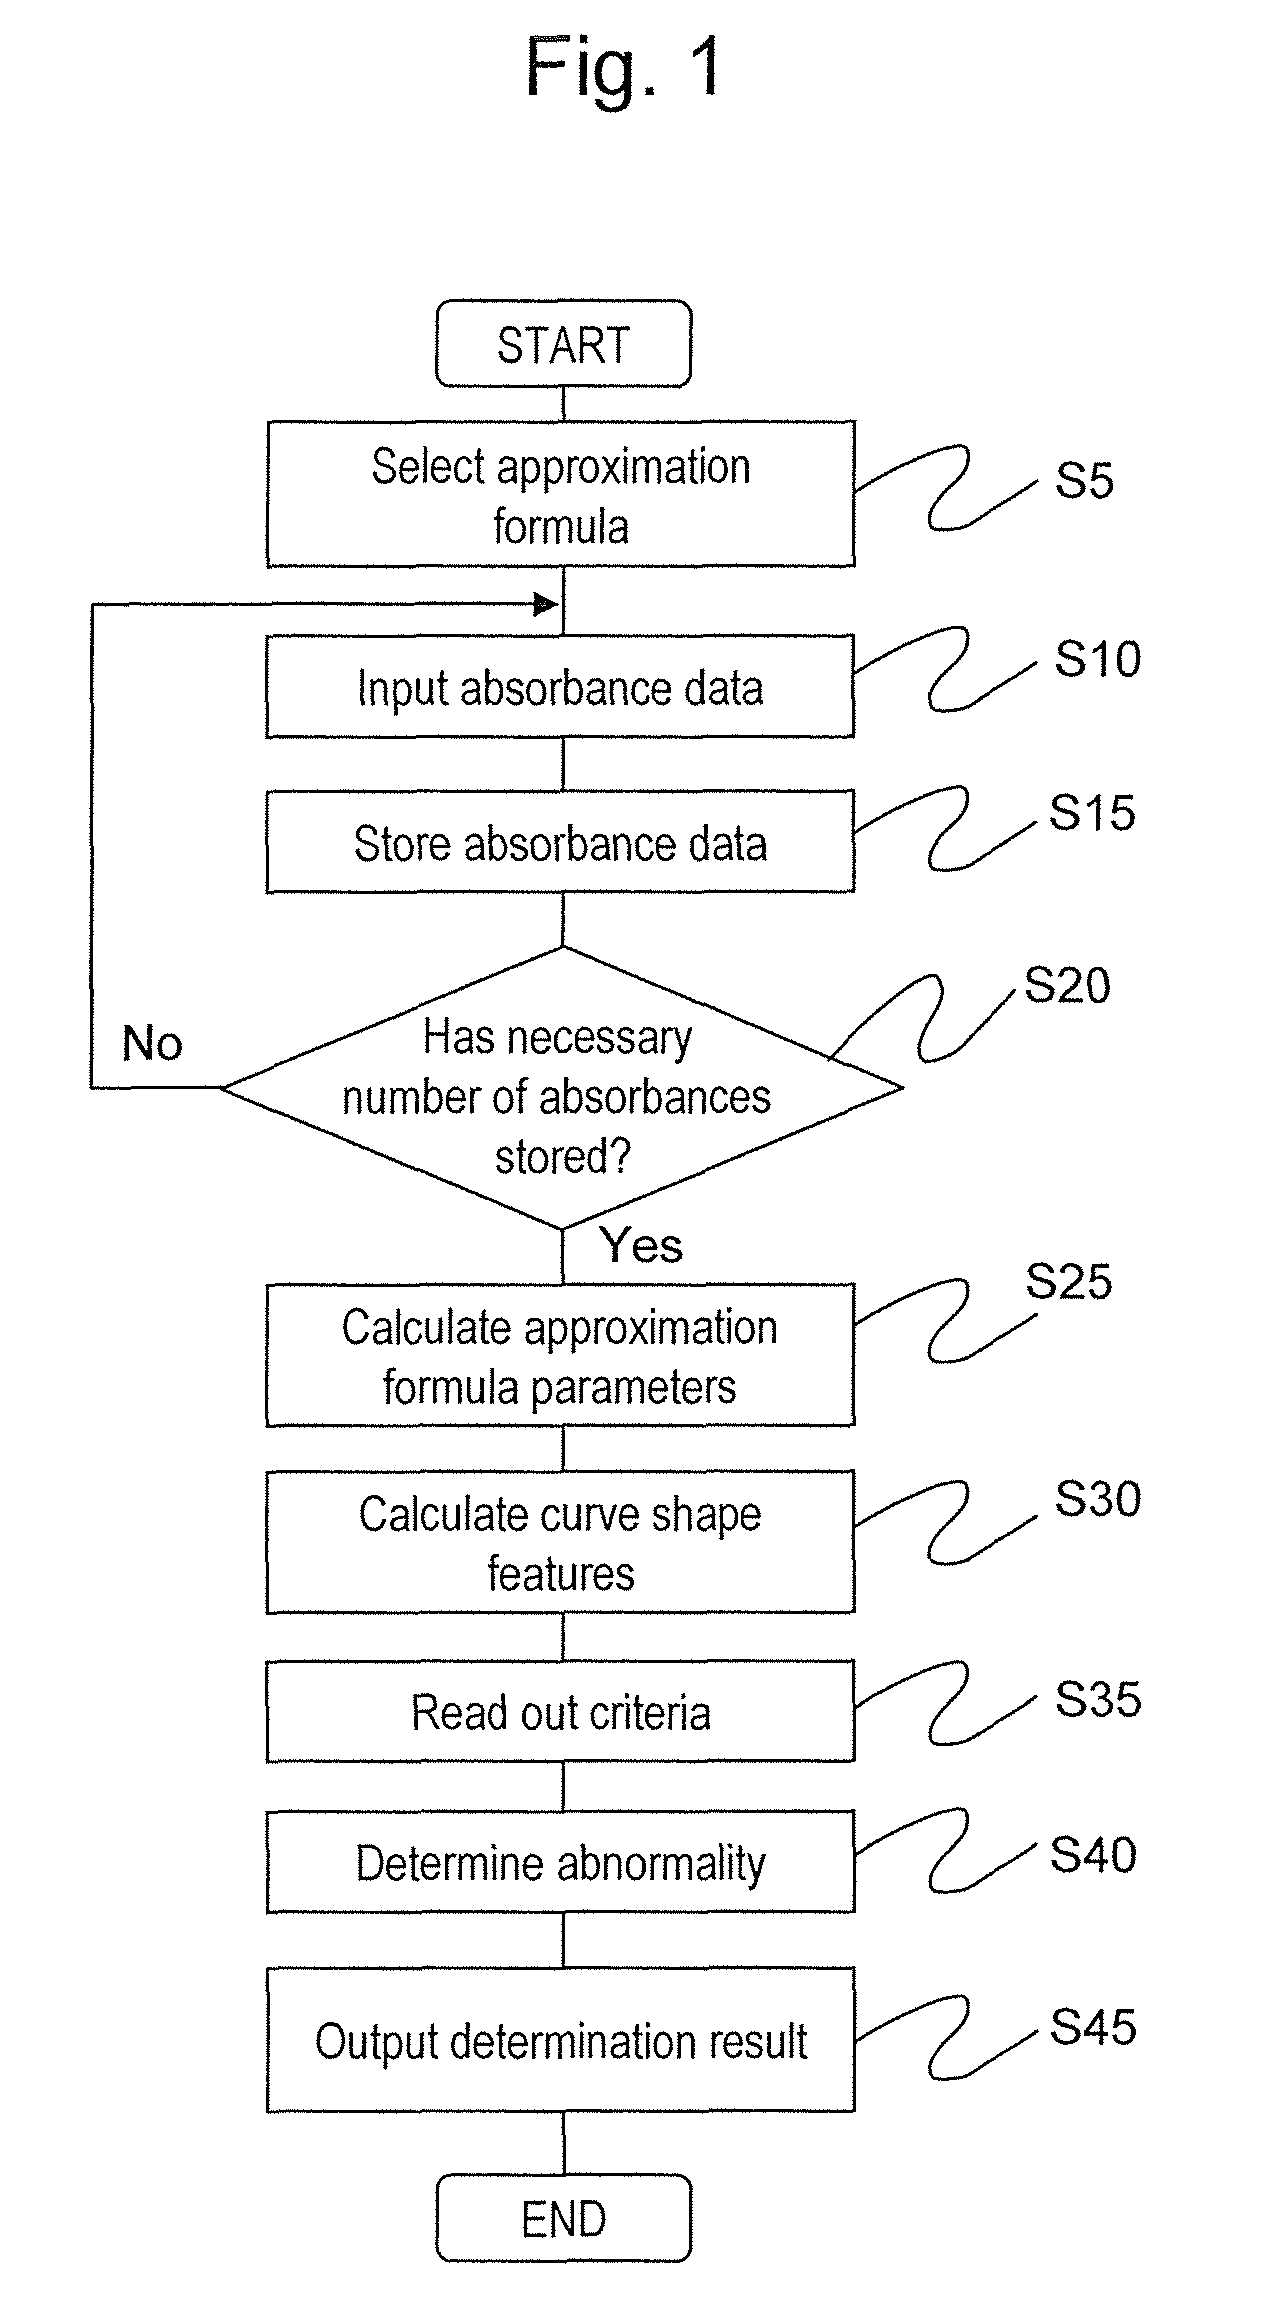
[0098]Next, details of a process by the control unit 13 determining abnormality based on the absorbance will be described with reference to FIG. 11. FIG. 11 is a diagram showing a processing step of the section related to abnormality determination in the control unit 13. The same reference numerals are provided to the processing steps for executing the same process as the abnormality determination process by the control unit 13 in the first embodiment shown in FIG. 1. The process from step S5 to step S30 is the same as the process from step S5 to step S30 of the first embodiment s...

third embodiment

[0108]Next, a third embodiment of the present invention will be described in detail with reference to the drawings. The schematic configuration of the biochemical automated analyzer according to the third embodiment is also shown in FIG. 5 as in the first embodiment. The operations other than the operation of the control unit 13 are the same as in the first embodiment, and the detailed description will not be repeated.

[0109]Next, details of a process by the control unit 13 determining abnormality based on the absorbance will be described with reference to FIG. 12. FIG. 12 is a diagram showing a processing step of the section related to the determination of abnormality in the control unit 13. The same reference numerals are provided to the processing steps for executing the same process as the abnormality determination process by the control unit 13 in the first embodiment shown in FIG. 1.

[0110]Although the functions for approaching the straight line are used as the formulas for appr...


PUM

PropertyMeasurementUnit
threshold numberaaaaaaaaaa
absorbanceaaaaaaaaaa
timeaaaaaaaaaa

Abstract

Provided are an automated analyzer and an automatic analysis method for highly accurately determining presence or absence of abnormality based on reaction process data obtained when concentration of a chemical component or an activity level of an enzyme is measured. The reaction process data is approximated by a function, and shape feature quantities indicating features of a shape of a curve section at an early stage of reaction are calculated. The obtained shape feature quantities are used to determine the presence or absence of abnormality.

Description

TECHNICAL FIELD[0001]The present invention relates to an automated analyzer that performs qualitative or quantitative analysis of a biological sample, such as blood and urine, and particularly, to an automated analyzer and an analysis method with a function of monitoring reaction of an analyzer for clinical examination.BACKGROUND ART[0002]An automated analyzer for clinical examination dispenses certain amounts of a sample and a reagent to stir and react the sample and the reagent. The automated analyzer measures absorbance of a reaction solution throughout a certain time and calculates a concentration, an activity value, and the like of a measurement target substance based on a measurement result.[0003]Reagents for each analysis item, a standard solution for calibrating the reagents, an quality control sample that is measured to check the states of the analyzer and the reagents in the analysis, and the like are necessary in addition to the analyzer in the analysis for clinical exami...

Claims


Application Information

Patent Timeline
Patent Type & Authority Patents(United States)
IPC IPC(8): G01N35/00
CPCG01N35/00663G01N35/00623G01N2035/0097G01N2035/00702
Inventor MITSUYAMA, SATOSHIMANRI, CHIHIROMIMURA, TOMONORIKAMIHARA, KUMIKO
Owner HITACHI HIGH-TECH CORP
Why Eureka
Try Eureka