An automatic test method and device of the radio resource management performance

A technology for wireless resource management and automated testing, applied in the directions of wireless communication, selection device, radio/inductive link selection arrangement, etc., to achieve automation, reduce manual participation, and facilitate analysis

Active Publication Date: 2007-10-17
DATANG MOBILE COMM EQUIP CO LTD
0 Cites 20 Cited by

AI-Extracted Technical Summary

Problems solved by technology

[0010] In view of the need to manually build a test environment and manually complete the test process in the prior art and the defects caused by it, the main purpose of the present invention is to more realistically s...

Method used

306: subtract the received signal code power value (PCCPCH RSCP) of the main public control physical channel at the near point according to the received signal code power value (PCCPCH RSCP) of the measured main public control physical channel extracted by the terminal to be calibrated to obtain the path that needs to be adjusted loss value, and adjust the attenuation value of the corresponding port of the common attenuator between the cell to be calibrated and the terminal and the corresponding port of the attenuator array unit corresponding to the terminal to be calibrated, so that the receiving signal of the main common control physical channel received by the terminal to be calibrated The code power value is the received signal code po...

Abstract

The invention relates to an automatic testing method and device in a PRM performance test, the method soloves disadvantages of errors and law efficiency when testing in a manually constructed testing entironment. The device includes one or more channel simulation units, one or more attenuation arraies, one or more terminal array units, a control monitoring centre which provides an interface for users to programme test scripts based on testing examples, for outside, and controls adjustable devices via a standard interface, for inside. A testing method corresponding to the device is proposed, which comprises an automatic aligning step and an automatic testing step which are performed by the control monitoring centre according to a receiving signal code power value of a main common control physical channel at a near point and a characteristic that uplink and downlink path loss are symmetrical. The technic of the invention completely replaces manually testing manner in a current technic, is capable of simulating an actual circumstance of a network more accurately and factually, and performing a test with multi-RRM algorithm interaction.

Application Domain

Technology Topic

Ultrasound attenuationRadio resource management +9

Image

  • An automatic test method and device of the radio resource management performance
  • An automatic test method and device of the radio resource management performance
  • An automatic test method and device of the radio resource management performance

Examples

  • Experimental program(1)

Example Embodiment

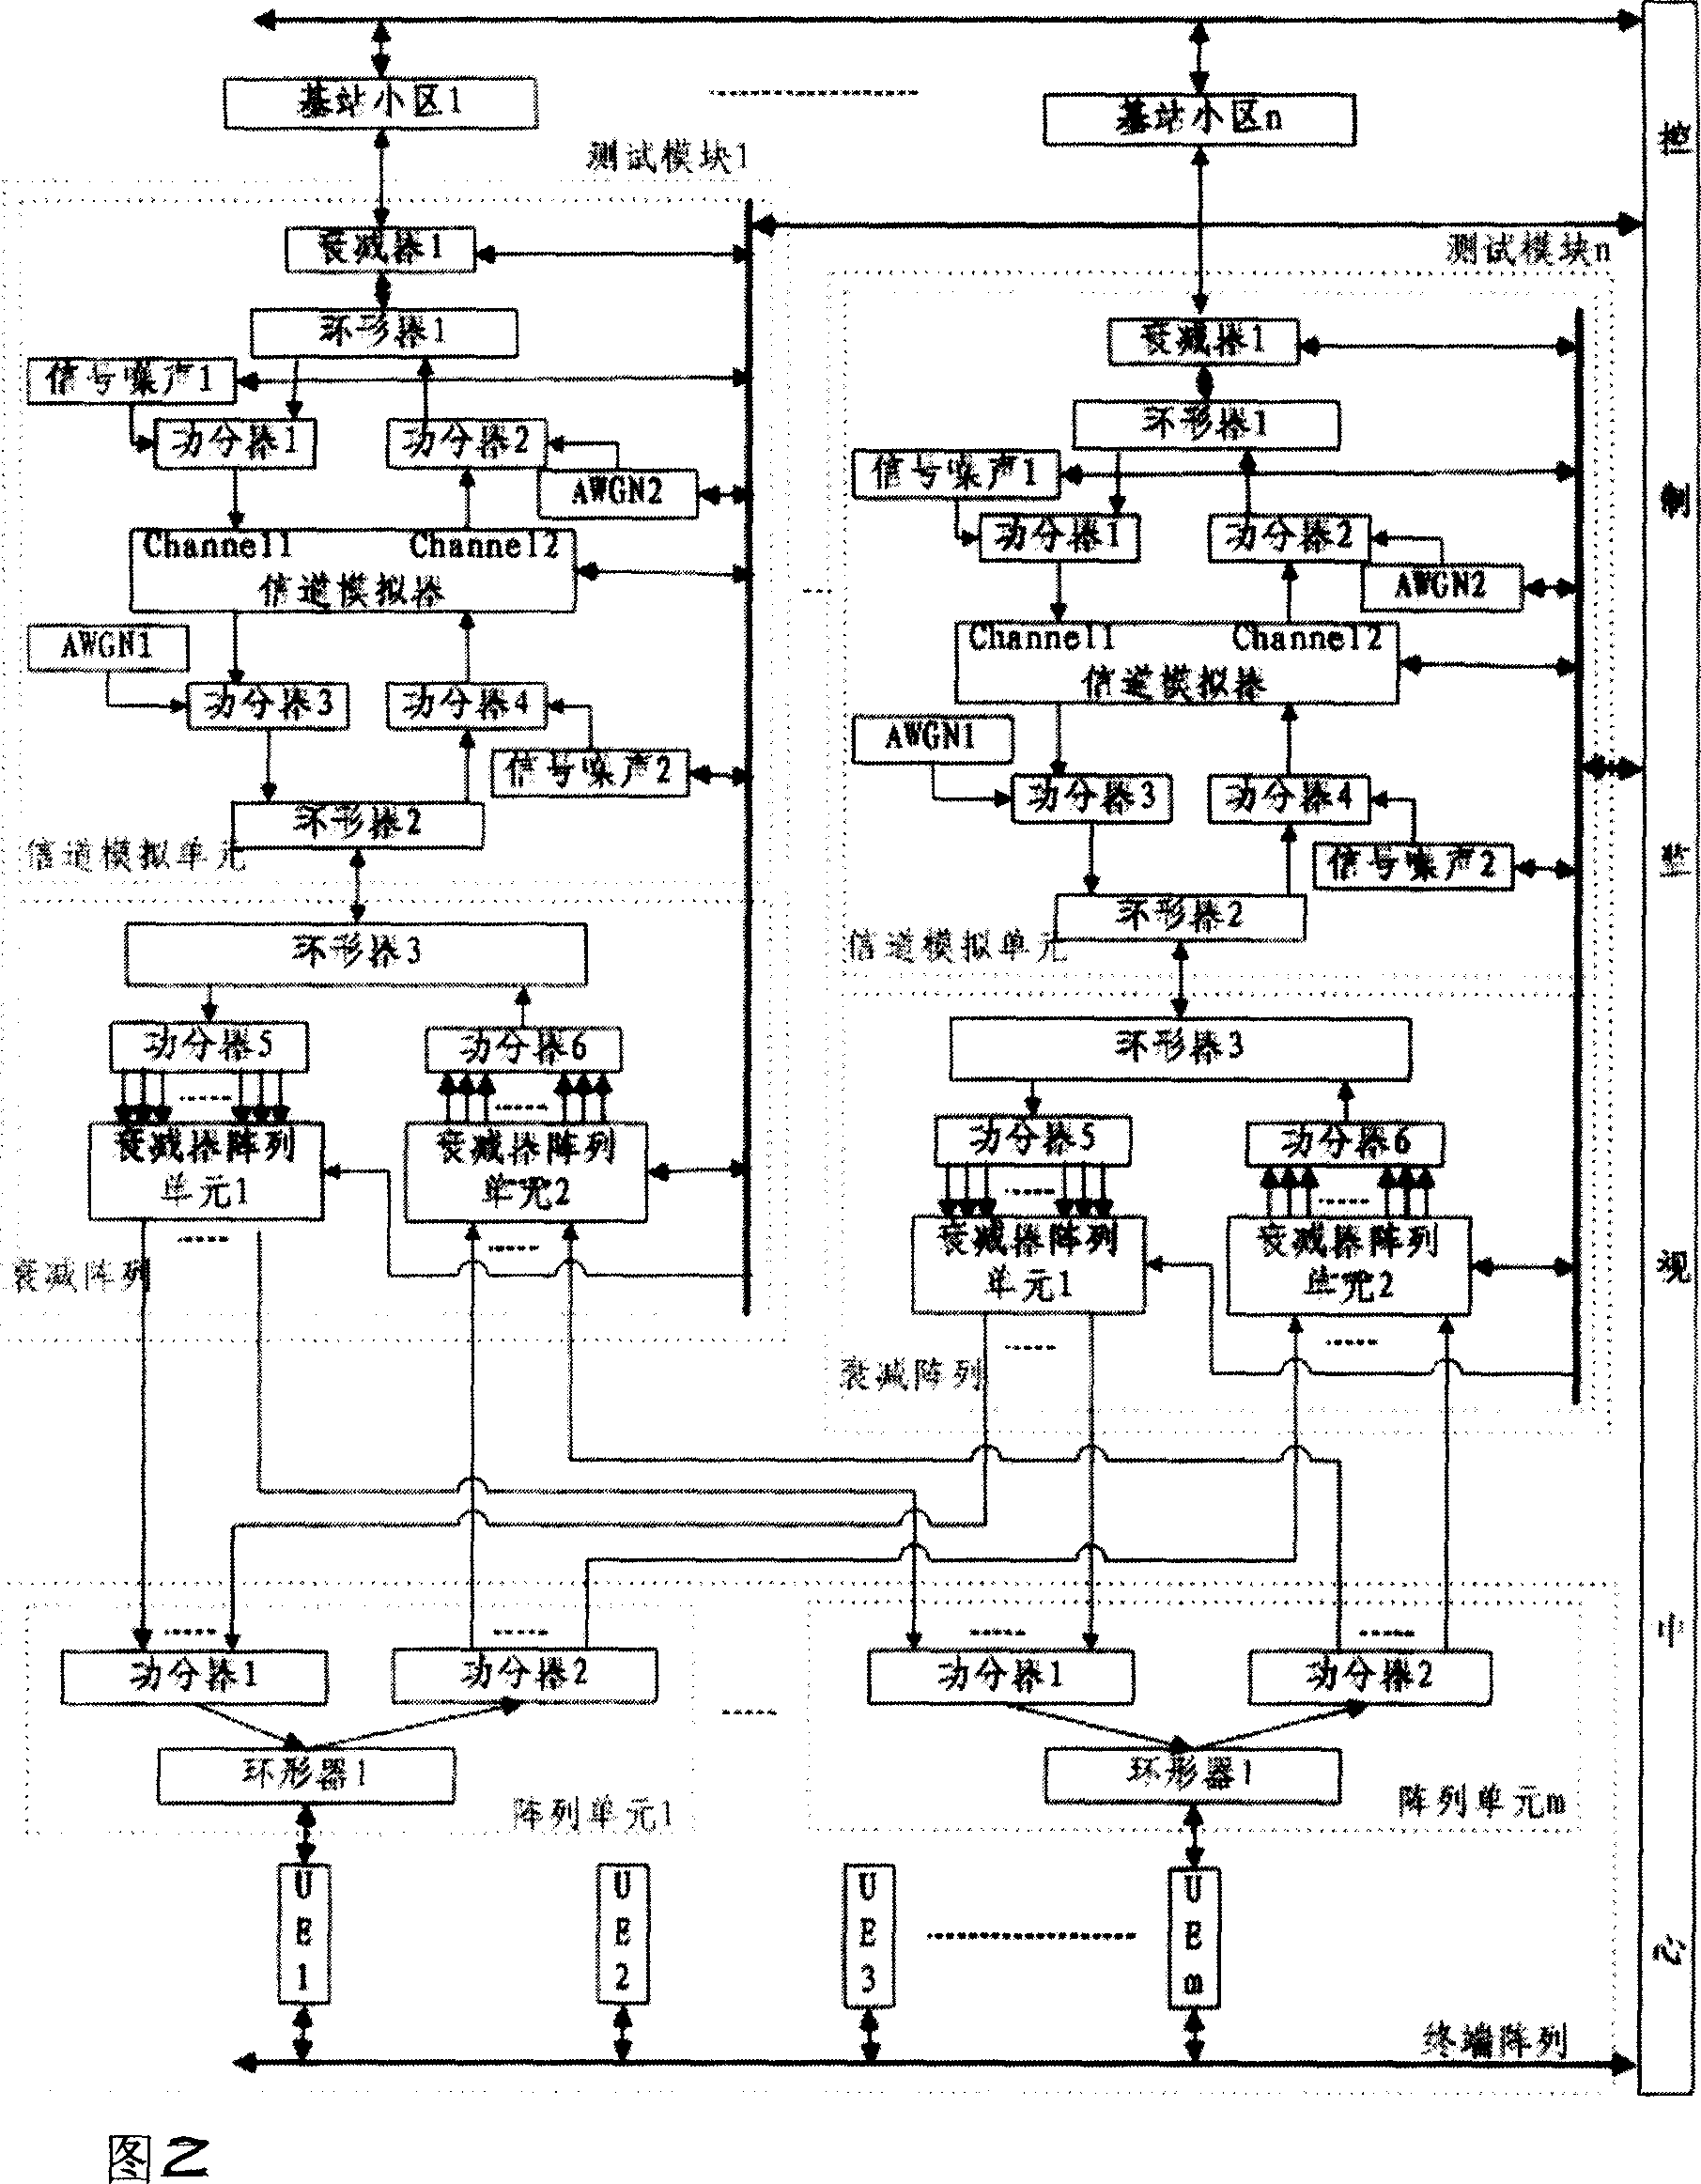
[0038] According to the air interface propagation characteristics of the mobile communication system, the device of the present invention connects one or more terminals in the terminal array to one or more cells respectively. The control and monitoring center has a control port and a monitoring port connected to the cell base station, terminal array, and attenuator , Additive white Gaussian noise (AWGN) noise source, signal noise source, channel simulator, attenuator array, automatic control of various adjustable devices, automatic link calibration and partial RRM algorithm testing.
[0039] Figure 2 shows the system structure diagram of the RRM performance test using the automated test device of the present invention. The part between a base station cell and the terminal array is called a test module, and a test module consists of a channel simulation unit and an attenuation array Composition, the internal composition of each test module is the same, and they are all connected to the control and monitoring center. Assuming that there are n test modules, which should correspond to n base station cells, the same terminal can be connected to multiple test modules. For example, at least two terminals, two terminal array units, two test modules, and two test modules are required for handover test. A cell base station. As shown in Figure 2, suppose there are n cell base stations, m test terminals (n and m are positive integers greater than 1), n ​​cell base stations should correspond to n test modules, and m test terminals should correspond to m terminal array units connected Each terminal array unit can be connected to k test modules as required, and k is a positive integer greater than or equal to 1 and less than n.
[0040] The signal of the cell first passes through the channel simulation unit in the test module, adds signal noise and AWGN noise to the channel simulation unit, and performs channel simulation through the channel simulator, and then connects to the terminal array unit through the attenuation array. The uplink and downlink signals of a certain terminal are individually controlled.
[0041] The channel simulation unit includes: a first attenuator, a first circulator, a second circulator, a first power divider, a second power divider, a third power divider, a fourth power divider, a first signal noise source, The second signal noise source, the first AWGN noise source, the second AWGN noise source, the channel simulator; the signal output from the cell or input to the cell is attenuated by the first attenuator (to prevent the input signal of the channel simulator from being overloaded during the downlink) , And then divide the signal into uplink and downlink signals by the first circulator. The downlink signal output by the first circulator is added to the signal noise generated by the first signal noise source through the first power divider and then input to the channel simulator, which is simulated by the channel The uplink signal output by the transmitter is added to the AWGN noise generated by the second AWGN noise source through the second power divider and then input to the first circulator; the uplink and downlink signals are controlled by the control and monitoring center in the channel simulator to be added to the multipath fading model; The downlink signal output by the channel simulator is added to the AWGN noise generated by the first AWGN noise source through the third power divider and then input to the second circulator, and the uplink signal output by the second circulator is added to the second circulator through the fourth power divider. The signal noise generated by the second signal noise source is input to the channel simulator; the second AWGN noise source and the first AWGN noise source add white noise to the uplink and downlink signal links respectively, and the second signal noise source and the first signal noise source are respectively Signal noise is added to the uplink and downlink signal links, and the signal noise interferes with the cell of the terminal or base station through the multipath fading model; the first attenuator, the first signal noise source, the second signal noise source, and the first AWGN noise The source, the second AWGN noise source, and the channel simulator are respectively connected to the control and monitoring center; the second circulator is connected to the attenuation array.
[0042] The attenuation array includes: a third circulator, a fifth power divider, a sixth power divider, a first attenuator array unit (ie, a downstream attenuation array unit), and a second attenuator array unit (ie, an upstream attenuation array unit). The attenuation array unit is actually composed of attenuators controlled by the control and monitoring center. Each attenuator is equivalent to a port, and each port is independent of each other. The port used to control the downstream signal is called the downstream port and is used for control. The uplink signal port is called the uplink port; the downlink signal from the cell is connected to the terminal through the downlink port, and the uplink signal from the terminal is connected to the cell through the uplink port; each attenuation array unit can include k ports, where k is A positive integer greater than 1, corresponding to this attenuation array unit can only access terminal array units less than or equal to k. The composition of the attenuation array is as follows: the third circulator is connected to the second circulator in the channel simulation unit, the downstream signal output by the third circulator is split through the fifth power splitter, and each downstream split signal passes through the first The corresponding port of the attenuation array unit is connected to the corresponding terminal array unit; the uplink signal output by each terminal array unit is connected to the sixth power divider through the corresponding port of the second attenuation array unit, and is combined by the sixth power divider Then it is input to the third circulator; the first and second attenuation arrays respectively realize the independent attenuation control of the uplink and downlink signals of each terminal. One port of each attenuation array unit corresponds to the input or output signal of an access terminal. The first and second attenuator arrays are respectively connected to the control and monitoring center;
[0043] The terminal array unit includes: a first power divider, a second power divider, and a first circulator;
[0044] The downlink signal output by the attenuation array corresponding to the cell is combined by the first power divider in the terminal array unit and then input to the first circulator, and the first circulator is connected to the terminal; the uplink signal output by the terminal passes through the first circulator. A circulator is split by a second power splitter, and the split uplink signals are respectively input to the attenuation array corresponding to the access cell; the first power splitter and the second power splitter are connected to one or more Connect with the terminal array corresponding to the cell. The first power divider or the second power divider needs to determine the specific model according to the number of cells connected to the terminal, such as one-to-two, one-to-four, one-to-eight, etc.
[0045] The key part of the automatic test device is the control and monitoring center. The control and monitoring center realizes the process of automatic calibration and automatic RRM testing; provides external interfaces for users to write control scripts and extract test data according to the process. Users input control scripts in text mode. The program realizes calling different functions according to key values ​​to realize the defined Process; internally realize the control of various instruments through standard interfaces, such as controlling signal sources through general-purpose interface bus (GPIB), network ports or serial ports, and controlling channel simulators and attenuation arrays in the GPIB interface Program-controlled attenuator, control the base station through the network port, and use the AT signaling set to control the terminal through the serial port or USB interface.
[0046] Before the test, the automatic test device is in the initial state: the cell is in an inactive state, the attenuation of the attenuator array and the attenuator is at the maximum, the noise source is off, and the channel simulator is in the bypass state. Figure 3 shows the flow chart of automatic calibration, which is as follows:
[0047] 301: The test system is in the initial state.
[0048] 302: Enter the cell and terminal number to be calibrated according to the test case design, and you can enter one or more.
[0049] 303: The control and monitoring center randomly or according to the input sequence selects a cell as the cell to be calibrated, and sets the attenuation value of the attenuator common to all terminals in the cell to be calibrated to the middle value of the attenuation range; the terminal to be calibrated corresponds to the cell to be calibrated The attenuation value of the corresponding port of the attenuator array unit is set to the middle value of the attenuation range;
[0050] 304: Activate the cell and turn on the terminal.
[0051] 305: Select one of the terminals connected to the cell to be calibrated as the terminal to be calibrated. If the terminal to be calibrated is the first terminal to be calibrated in the cell to be calibrated, perform step 306; otherwise, perform step 307.
[0052] 306: Calculate the path loss value that needs to be adjusted according to the actual measured received signal code power value (PCCPCH RSCP) of the primary public control physical channel extracted by the terminal to be calibrated minus the received signal code power value of the primary public control physical channel at the near point, And adjust the shared attenuator between the cell to be calibrated and the terminal and the attenuation value of the corresponding port of the attenuator array unit corresponding to the terminal to be calibrated, so that the received signal code power value of the primary common control physical channel received by the terminal to be calibrated It is the received signal code power value of the main common control physical channel at the near point; at the same time, it is ensured that the input of the channel simulator is not overloaded.
[0053] The transmission code power value of the primary common control physical channel extracted by the cell to be calibrated is subtracted from the received signal code power value of the primary common control physical channel at the near point to obtain the path loss value of the entire downlink path.
[0054] Control the terminal to be calibrated to initiate a terminal-to-terminal call, and use the transmit power value of the dedicated physical channel (DPCH) extracted by the terminal to be calibrated minus the received power value of the dedicated physical channel extracted by the cell to be calibrated to obtain the to-be-calibrated cell The uplink path loss value corresponding to the terminal, and then adjust the uplink attenuation value of the corresponding port in the attenuator array unit corresponding to the terminal to be calibrated so that the uplink and downlink path loss values ​​of the terminal to be calibrated are equal. Step 308 is executed after the setting is completed.
[0055] 307: Set the attenuation value of the corresponding port of the attenuator array unit corresponding to the terminal to be calibrated according to the attenuation value of the corresponding port of the uplink and downlink attenuator array unit of the first calibrated terminal in the cell to be calibrated; then, control the The terminal to be calibrated initiates a call, calculates the uplink and downlink path loss values, fine-tunes the attenuation value of the corresponding port of the attenuator array unit corresponding to the terminal to be calibrated, so that the received signal code power value of the main common control physical channel received by the terminal to be calibrated is close The value at the point, and make the uplink and downlink path loss consistent;
[0056] The received signal code power value of the primary common control physical channel at the near point means that the PCCPCH RSCP received by the test terminal is -70dBm.
[0057] 308: The control and monitoring center judges whether all the terminals of the cell to be calibrated have been calibrated, execute 309 if it is completed; if not, execute step 305 to calibrate other terminals of the cell to be calibrated.
[0058] 309: The control and monitoring center judges whether all the cells have been calibrated, if yes, the calibration process is ended; otherwise, step 303 is executed to perform calibration of other cells.
[0059] During the testing process, the control and monitoring center can fully automate the automatic control of each adjustable device according to the test script, without human intervention and adjustment, and can more realistically simulate the time-varying characteristics of the path loss and control the attenuation of multiple UEs. And mobile, which can simulate a more realistic actual network environment.
[0060] Figure 4 shows the flow chart of the automatic handover test. It is assumed that terminal 1 (UE1) and terminal 2 (UE2) reside in cell 1 (cell1), and terminal 3 (UE3) and terminal 4 (UE4) reside in cell 2 ( cell2), make UE1 and UE2 switch from cell1 to cell2 (based on signal strength), and make UE3 and UE4 switch from cell2 to cell1 at the same time, repeat the switch a certain number of times, and count the success rate of the switch. The automatic test process is as follows: First, adjust the distance between UE1 and UE2 and the two cells so that UE1 and UE2 are close to cell1 (after automatic calibration, they are in this state), and at the same time outside the coverage of cell2 (according to the simulation environment) Or the data collected by the experimental network, determine the signal strength of cell 2 to the terminal, calculate the difference between the signal strength and -70dBm), and adjust the attenuation value of the corresponding port between the terminal and the attenuator array of cell2, and adjust UE3 and UE4 in the same way. Distance between 2 cells; Next, set the channel simulator, set the frequency of the channel simulator according to the frequency information of the cell, set the case3 or case1 environment to simulate the fast fading environment; Next, determine the time variation of the attenuation value of the attenuator array Characteristics, simulating a slow fading environment, according to the path loss formula in an urban environment, the relationship between the path loss and the distance d between the base station and the terminal can be calculated (formula 1):
[0061] L(dB)=46.3+33.9×log(f)-13.82×log(H b )-a(H m )
[0062] +[44.9-6.55×log(H b )]×log(d)+C m (Formula 1)
[0063] among them:
[0064] a(H m )=[1.1×log(f)-0.7]×H m -[1.56×log(f)-0.8]
[0065] Hb: base station height, unit m
[0066] Hm: UE height in m
[0067] Cm: Compensation value for different environments, generally 0 for cities
[0068] D: The distance between the terminal and the cell, in km.
[0069] According to the speed corresponding to case3 or case1, the relationship between the time-varying path loss can be calculated (you can also use the time-varying path loss characteristics collected by the test network); the control terminal is connected to the service separately, and the time-varying path loss characteristics calculated in the previous step are used. Respectively adjust the attenuation value of the corresponding port of the corresponding attenuation array to realize the handover of different terminals between different cells; the base station and the terminal side record the signal strength and block error rate (BLER) at the time of the handover during the handover process, and the terminal records at the same time The handover process is reported to the control and monitoring center. If the handover fails, stop the attenuation adjustment process, reconnect to the user who dropped the call, and start the handover test again. The completion of the test gives the success rate of the handover.
[0070] In addition to the handover test, other RRM tests such as load congestion control (LCC), radio link monitoring (RLS), power control (PC), packet scheduling (PS), etc. can all be tested using the device shown in Figure 2. The use case design determines the control plan of the automatic device and writes the control script to realize the automatic test. In the power control (PC) test, in order to verify the performance of the uplink and downlink outer loop against slow fading, first select several terminals in a cell to calibrate and connect to the service, then set the channel simulator to simulate the multipath environment and set the uplink and downlink interference Then adjust the attenuation value of the corresponding port of the corresponding attenuation array according to the time-varying characteristics of the uplink and downlink path loss, realize the terminal movement in the cell, record the change of the uplink and downlink BLER value, and evaluate the accuracy of the outer loop power control according to the change of the BLER value . There are many test points for LCC, RLS, PS and other algorithms. For example, RLS will trigger handover, fast dynamic channel allocation (FDCA), PS, etc. Users can write different control scripts for different test points.
[0071] Some other tests, such as receiving sensitivity test, which require environmental calibration, can also be automatically calibrated using the device shown in Figure 2.
[0072] In the case of multiple algorithm interactions, you need to turn on the input switch of the algorithm to be tested on the radio network controller (RNC). The device of the present invention controls different UEs according to the time-varying characteristics of the path loss collected by the experimental network. The UE depends on the attenuation of the test strategy), which simulates the movement of the UE between cells. During the movement of the UE, a measurement report will be reported to the RNC, and the RNC will call different algorithms, and finally calculate the system indicators such as call drop rate, Handover success rate, throughput, etc., to verify whether the performance indicators of the system can be achieved. If the system index cannot be reached, it is necessary to manually analyze the log generated by the device to find out whether the cause is a parameter setting problem or a program implementation problem.

PUM

no PUM

Description & Claims & Application Information

We can also present the details of the Description, Claims and Application information to help users get a comprehensive understanding of the technical details of the patent, such as background art, summary of invention, brief description of drawings, description of embodiments, and other original content. On the other hand, users can also determine the specific scope of protection of the technology through the list of claims; as well as understand the changes in the life cycle of the technology with the presentation of the patent timeline. Login to view more.

Similar technology patents

Human eyesight measuring apparatus and method thereof

InactiveCN1843286AAutomateRealize information managementRefractometersSkiascopesMeasurement deviceHuman eye
Owner:深圳市亮睛医疗设备有限公司

Classification and recommendation of technical efficacy words

  • Automate
  • Reduce manual involvement

Commodity ex-warehouse method

Owner:BEIJING JINGDONG ZHENSHI INFORMATION TECH CO LTD

Configuration data dynamic updating system and method based on application cluster

ActiveCN107465714AAutomateReal-time data updateTransmissionOperating systemData dynamics
Owner:北京思特奇信息技术股份有限公司
Why Eureka
Try Eureka