Composite profiles of cell antigens and target signal transduction proteins for analysis and clinical management of hematologic cancers
A target protein and protein technology, which is applied in the field of complex distribution of cell antigens and target signal transduction proteins for blood cancer analysis and clinical treatment, can solve the problems of not getting better results, not receiving treatment, and not being able to prolong survival
- Summary
- Abstract
- Description
- Claims
- Application Information
AI Technical Summary
Problems solved by technology
Method used
Image
Examples
Embodiment 1
[0085] Prepare samples for building composite distributions
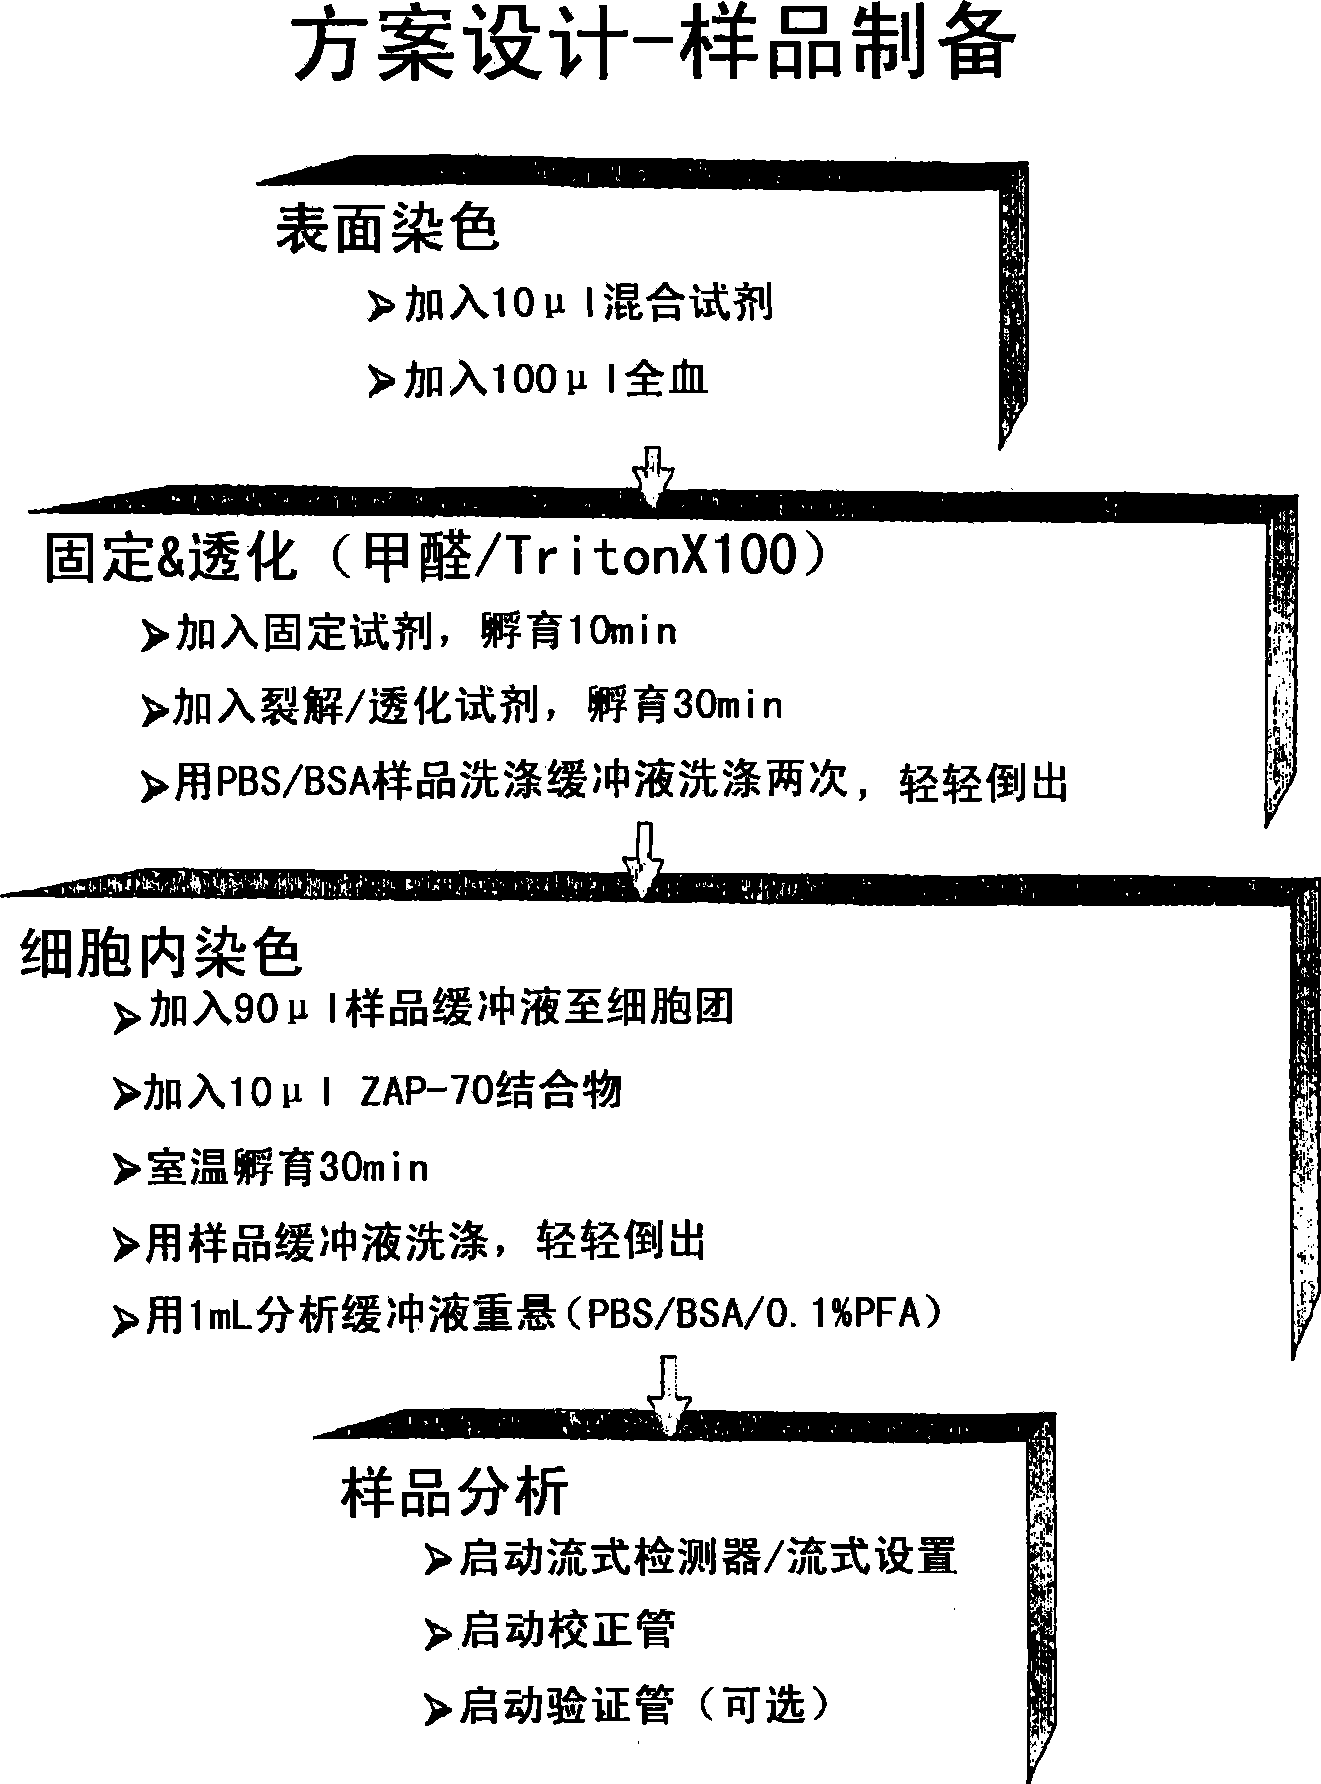
[0086] This example shows the sample preparation procedure used to establish a composite profile for an individual suspected of having B-cell chronic lymphocytic leukemia (B-CLL).
[0087] In summary, 10 μl of reagent mixed with cell surface markers CD5-FITC, +CD3-ECD, +CD56-PC5, +CD19-PC7 was added to vials and 100 μl of whole blood was added. Incubate at room temperature for 20 min, add 64 μl of fixative solution (10% formaldehyde) and incubate at room temperature for 10 min. Next, 1 mL of lysis / permeabilization reagent (0.1% Triton X-100) was added, incubated at room temperature for 30 min, and then centrifuged. Wash the cells twice with buffer (PBS containing 2% BSA), resuspend with 10 μl anti-ZAP-70-PE and 90 μl buffer, incubate at room temperature for 30 min, then wash once with buffer, wash with 0.1% polysaccharide Resuspend in formaldehyde buffer. Samples were then analyzed by flow cytometry. figure 1 ...
Embodiment 2
[0089] Analysis of samples used to create composite distributions
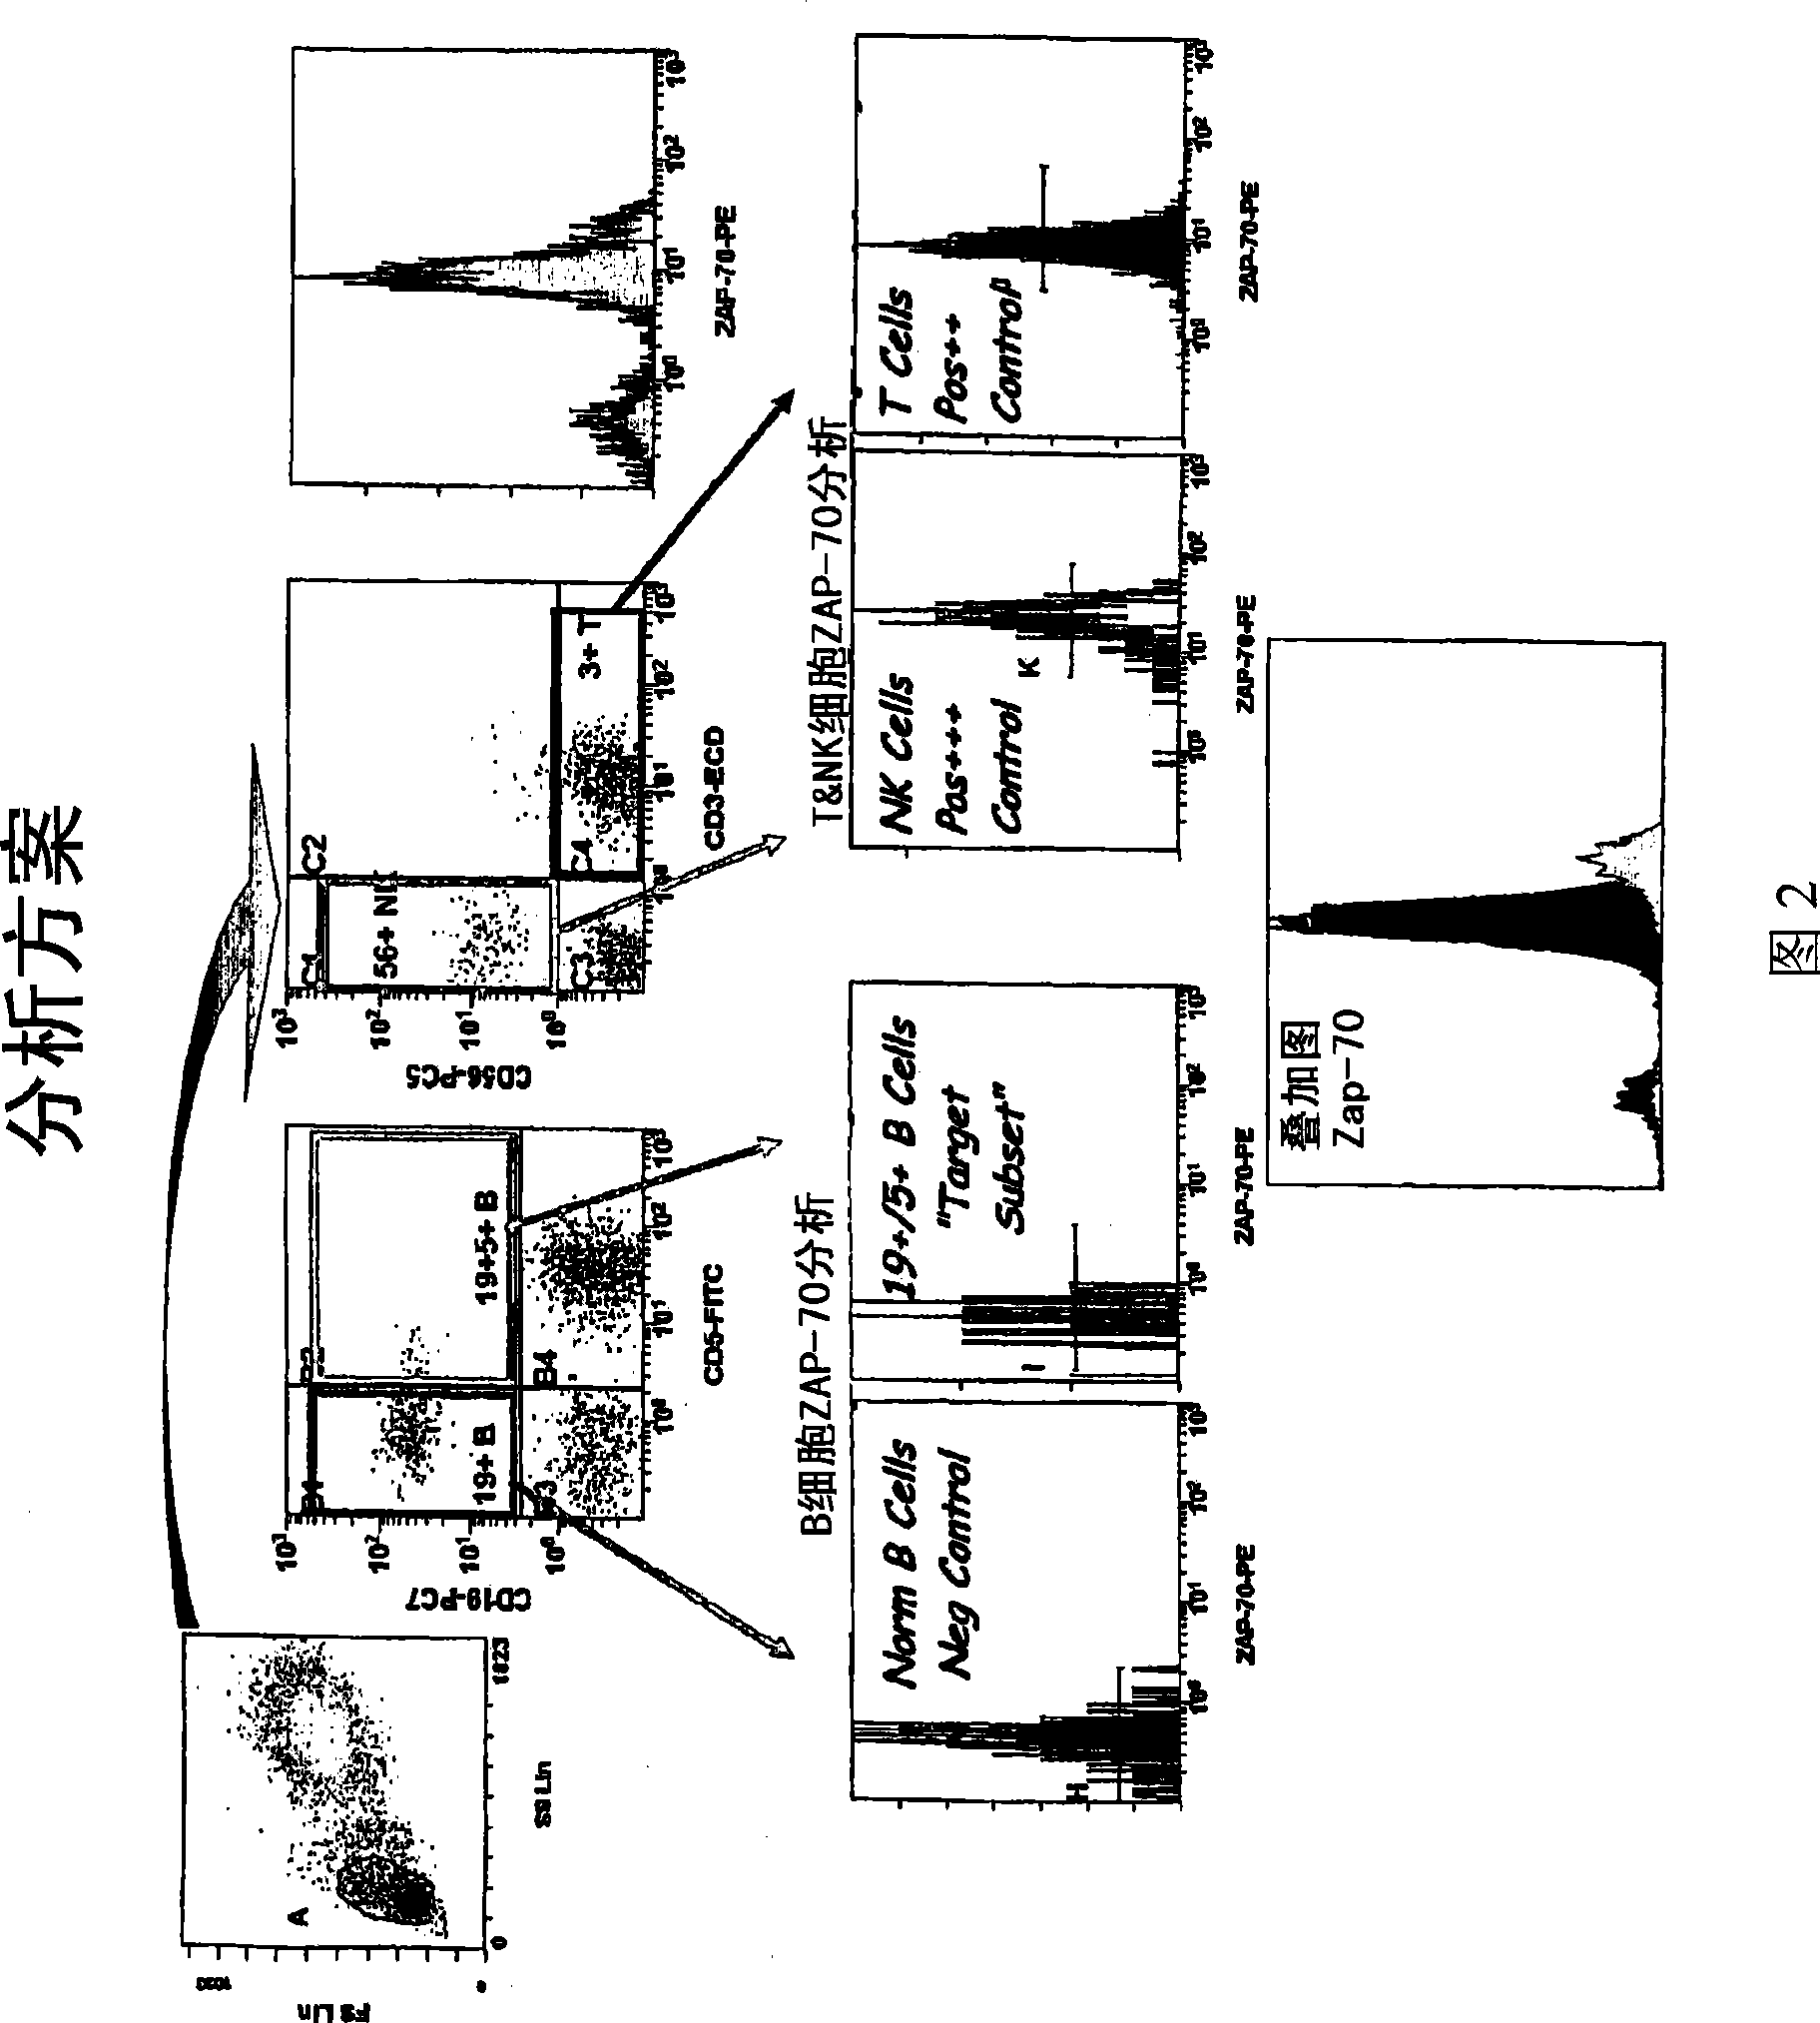
[0090] This example shows the analysis of samples by flow cytometry to create a composite profile.
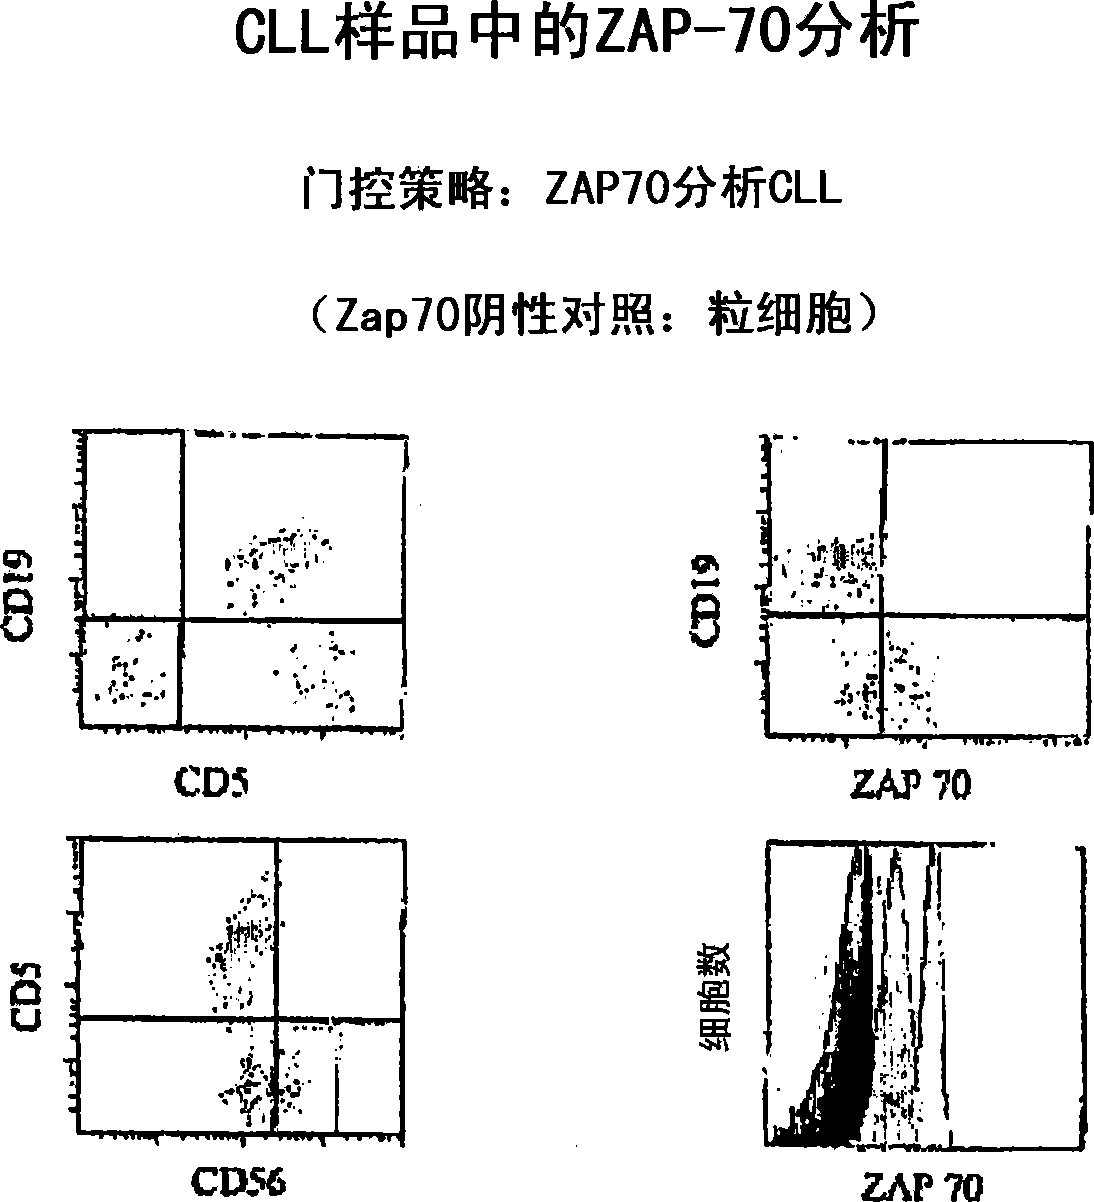
[0091] As shown in Figure 2, the ZAP-70 gating / analysis algorithm was used to build the composite distribution as follows: the first gate of normal whole blood samples was used to identify lymphocytes (blue plus green) by light scattering, as shown in the upper left histogram Show. If desired, CD45 side scatter (linear scale) can be used to gate CD45-bright lymphocytes in peripheral blood for CD4 enumeration, while CD45 side scatter (log scale) can be used to identify bone marrow mesoderm group for phenotyping. In Figure 2, a histogram of CD19 versus CD5 identifies normal B cells (purple, upper left quadrant), normal T cells (blue, lower right quadrant), and "pre" B cells in normal peripheral blood (CD19+5+, upper right quadrant). B-CLL neoplastic transformed cells also fell into the upper right quadrant,...
PUM
 Abstract
Description
Claims
Application Information
 - R&D
- Intellectual Property
- Life Sciences
- Materials
- Tech Scout
- Unparalleled Data Quality
- Higher Quality Content
- 60% Fewer Hallucinations
Browse by: Latest US Patents, China's latest patents, Technical Efficacy Thesaurus, Application Domain, Technology Topic, Popular Technical Reports.
© 2025 PatSnap. All rights reserved.Legal|Privacy policy|Modern Slavery Act Transparency Statement|Sitemap|About US| Contact US: help@patsnap.com


