

Diagram and line real-time conversion analyzing method and system thereof
An analysis method and spectral line technology, applied in the field of data analysis in the field of analytical chemistry, can solve the problems of not realizing real-time performance and achieve high fusion effect
- Summary
- Abstract
- Description
- Claims
- Application Information
AI Technical Summary
Problems solved by technology
Method used
Image

Examples
Embodiment 1
[0036] Embodiment 1: The system of the present invention is applied to surface plasmon resonance imaging equipment
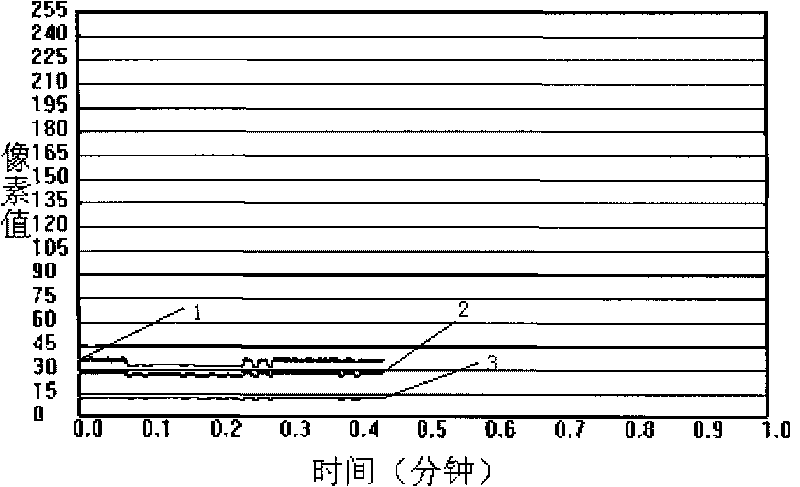
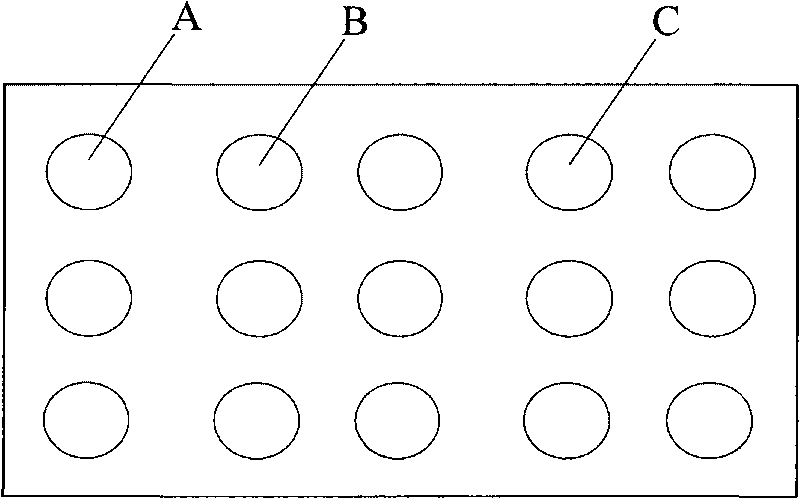
[0037] Such as figure 2 As shown, the three one-dimensional spectral lines take time as the abscissa, and the pixel gray value as the ordinate, and image 3 2D plots in and Figure 4 Corresponds to the selected area in the 3D map. Among them, spectral line 1 represents the situation of the pixel value of pixel area A or pixel point I changing with time; spectral line 2 represents the situation of pixel value of pixel area B or pixel point II changing with time; spectral line 3 represents the situation of pixel area C or pixel point II How the pixel value of point III changes over time. Spectral line 1, spectral line 2 and spectral line 3 are refreshed in real time and displayed in different colors.
[0038] Such as image 3 As shown, a screenshot of a frame of two-dimensional image in the real-time acquisition image, the selected pixel area A, pixel area B...
Embodiment 2
[0042] Embodiment 2: The system of the present invention is applied to separate signal processing
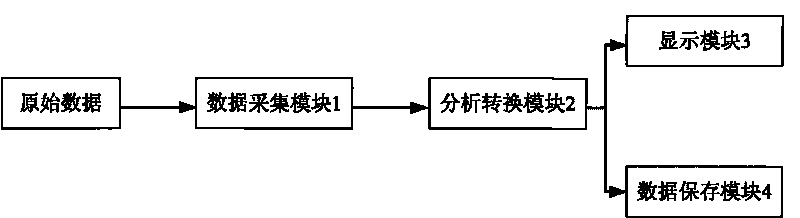
[0043] At present, there are two main ways to deal with separation signals: one is to separate by a fixed time, with distance as a variable, such as slab gel electrophoresis, thin layer chromatography, etc.; the other is to separate by a fixed length, with time as a variable , such as capillary electrophoresis, gas chromatography, liquid chromatography, etc.; the signals of the above two methods can be converted to each other. When applying the real-time one-dimensional spectrum to two-dimensional diagram method of the present invention for signal conversion, the one-dimensional spectral line signal collected by the data acquisition module 1 is input into the analysis conversion module 2 and converted into a two-dimensional diagram in real time, and the user can Instantly observe the chromatogram of the separated signal through the display module 3.
PUM
 Abstract
Description
Claims
Application Information