Method for rapid determination of tannin content in Slvia Miltiorrhiza Bunge extracting solution
A technology for rapid determination and extraction of liquids, which can be used in the measurement of color/spectral properties, medical preparations containing active ingredients, pharmaceutical formulations, etc. problems, to achieve the effect of simple operation, convenient and easy-to-obtain instruments and equipment, and fast measurement speed
- Summary
- Abstract
- Description
- Claims
- Application Information
AI Technical Summary
Problems solved by technology
Method used
Image
Examples
Embodiment 1
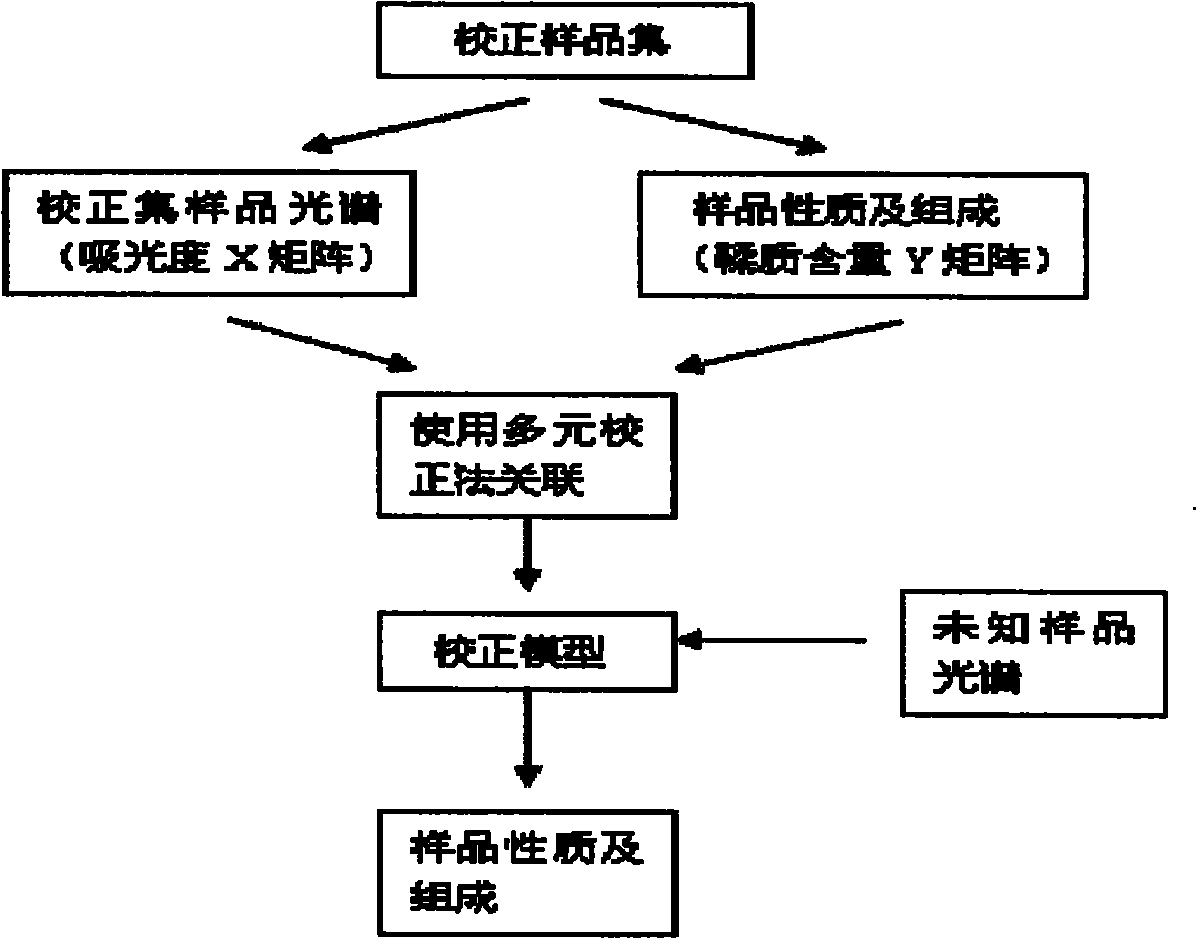
[0051] Method flow see figure 1 .
[0052] 1. Calibration set sample collection:
[0053] A total of 53 samples of Danshen extract were collected from 22 batches of 22 batches of the first extraction, 17 extractions of the second extraction, and 14 extractions of the third extraction, as the calibration set samples.
[0054] 2. Determination of the reference value of the calibration set sample:
[0055] The phosphomolybdotungstic acid / casein method in Appendix XB of the Chinese Pharmacopoeia of the 2005 edition was used to determine the tannin content of the calibration set samples, and the color reaction time was uniformly controlled to 30 minutes. The distribution range of tannin content in calibration set samples was 11.2-303.5 μg / ml.
[0056] 3. Calibration set sample UV spectrum data collection:
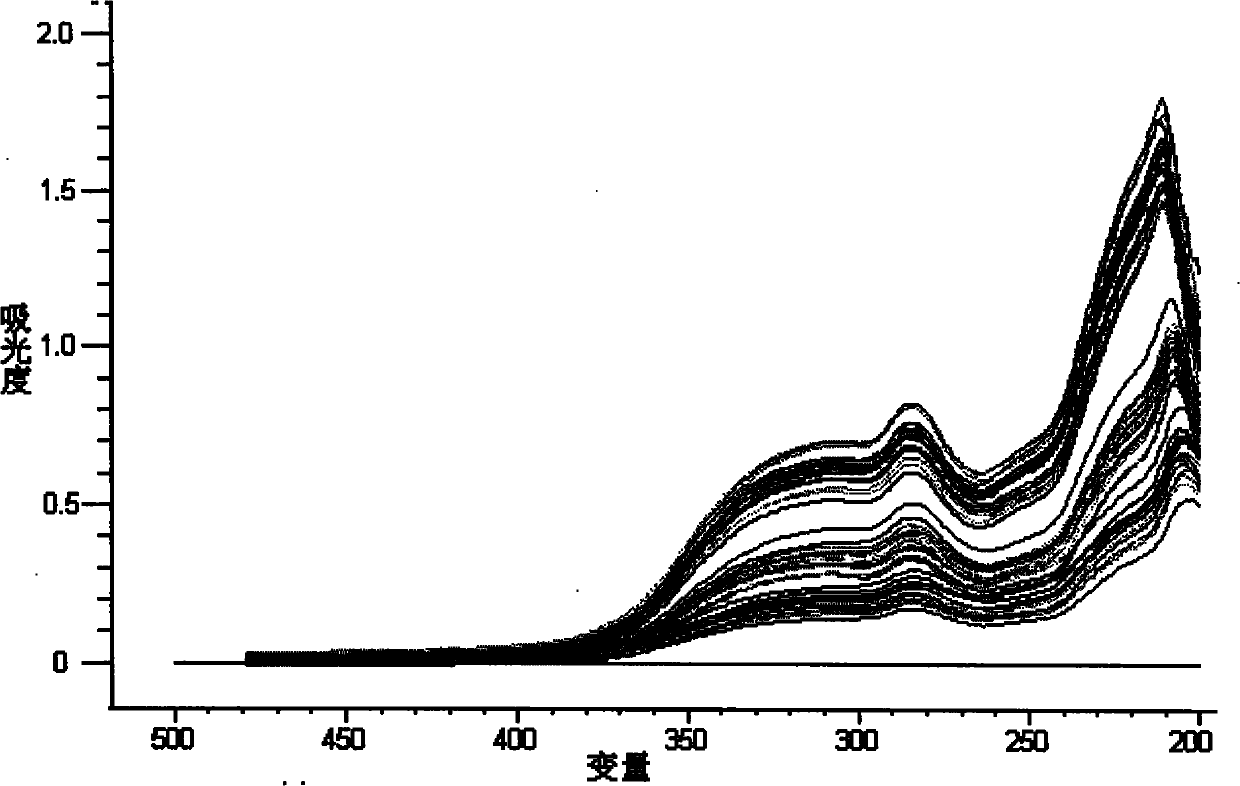
[0057] Take the calibration set sample, quantitatively dilute 100 times with water, mix, filter, take the filtrate, put it in a 0.5cm quartz cuvette, and use a UV-visible sp...
Embodiment 2
[0076] According to the method of Example 1, the difference is that the partial least squares regression (PLS) method is used to establish a tannin quantitative calibration model, and the leave-one-out method is used for full crossover for internal validation. Quantitative analysis using Unscrambler9.6 software.
[0077] 1. Select the same calibration set sample data as in Example 1.
[0078] 2. Use the Unscrambler9.6 software to select the band of the spectrum. It can be seen from Table 3 that the selection of the band has no significant impact on the performance of the model established by the PLS method. PLS regression selects the 250nm ~ 480nm band to establish the tannin content model tannin, and the model performance is relatively optimal, that is, the correlation coefficient R 2 The maximum is 0.937, and the minimum RMSECV is 18.6μg / ml. The 250-480nm band was selected to establish the quantitative regression model of tannin by PLS method. The correlation diagram betw...
PUM
 Abstract
Description
Claims
Application Information
 - R&D
- Intellectual Property
- Life Sciences
- Materials
- Tech Scout
- Unparalleled Data Quality
- Higher Quality Content
- 60% Fewer Hallucinations
Browse by: Latest US Patents, China's latest patents, Technical Efficacy Thesaurus, Application Domain, Technology Topic, Popular Technical Reports.
© 2025 PatSnap. All rights reserved.Legal|Privacy policy|Modern Slavery Act Transparency Statement|Sitemap|About US| Contact US: help@patsnap.com


