Water peak treatment method in proton magnetic resonance spectroscopy signal
A processing method and magnetic resonance technology, applied in medical science, sensors, diagnostic recording/measurement, etc., can solve problems such as residual water peaks, result changes, influence quantitative processing, etc., and achieve the advantages of accuracy, ease of implementation, and computing speed. Effect
- Summary
- Abstract
- Description
- Claims
- Application Information
AI Technical Summary
Problems solved by technology
Method used
Image
Examples
Embodiment 1
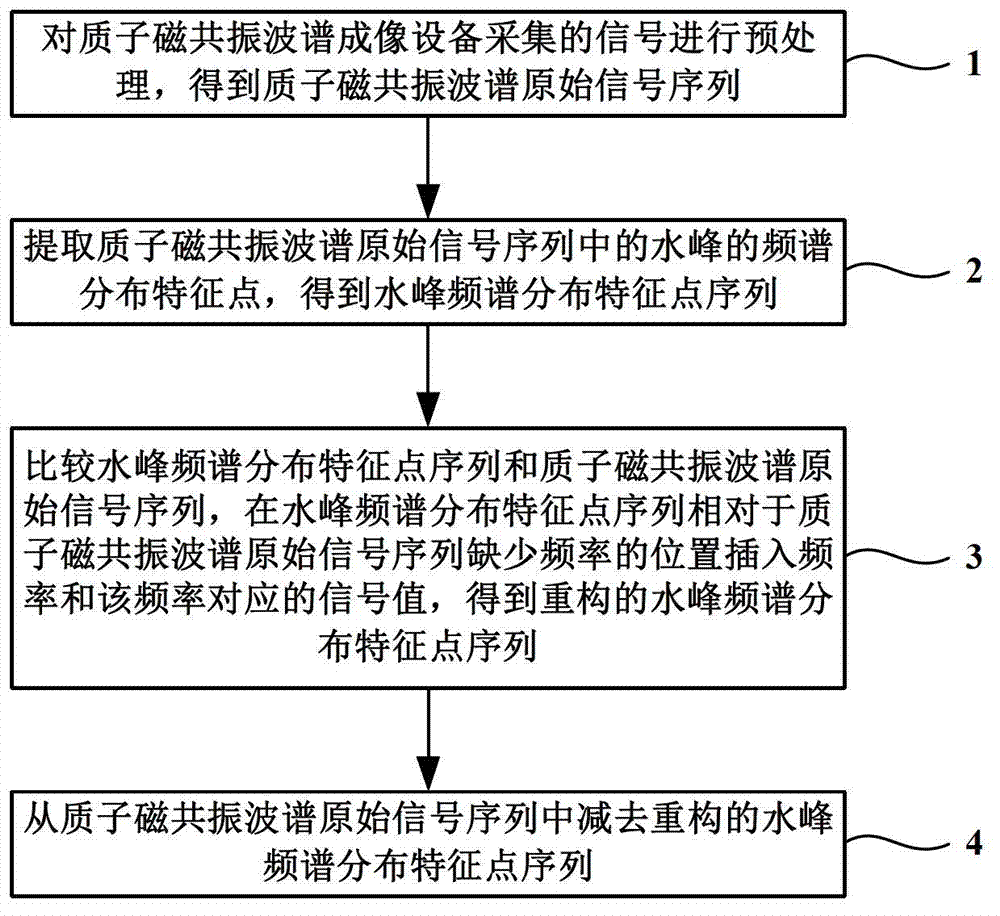
[0062] figure 1 It is a flowchart of the water peak processing method in the proton magnetic resonance spectrum signal. Such as figure 1 As shown, the water peak processing method in the proton magnetic resonance spectrum signal provided by the invention comprises:
[0063] Step 1: Preprocessing the signals collected by proton magnetic resonance spectroscopy to obtain the original signal sequence of proton magnetic resonance spectroscopy.
[0064] The preprocessing of the signal collected by proton magnetic resonance spectroscopy includes the processes of suppressing noise, correcting frequency spectrum and correcting phase.
[0065] The main method of suppressing noise is apodization. The method of apodization and noise suppression is to multiply the time-domain signal by an exponential decay function. This method can adapt to the original signal model and increase the weight of the initial signal value. Since the proportion of noise in the initial signal value is very sma...
Embodiment 2
[0096] The process of this embodiment is roughly similar to that of Embodiment 1, except that in step 2, when obtaining the sequence of feature points of the water peak spectrum distribution, a broken line approximation method is used.
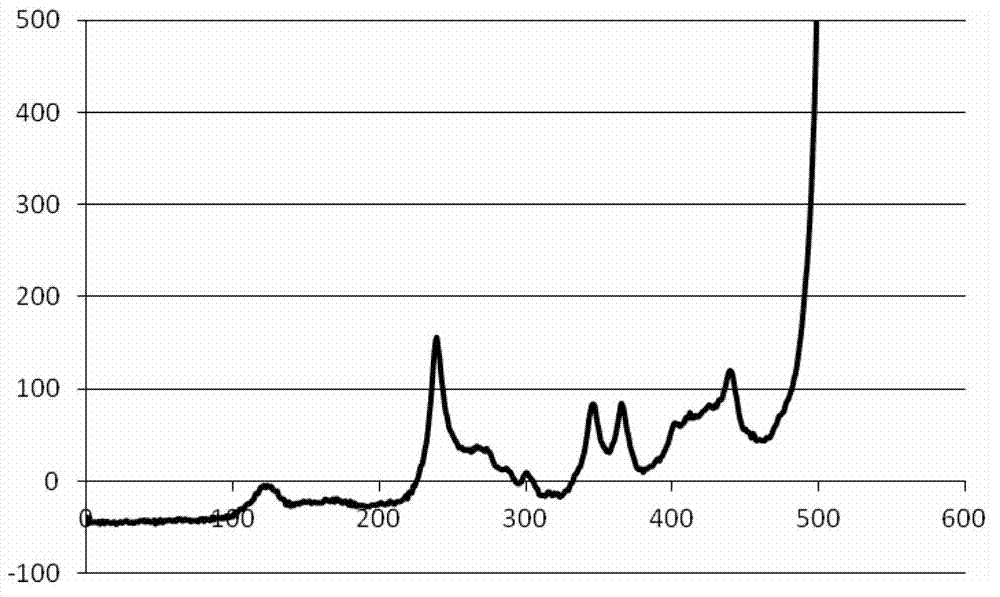
[0097] Step 1: Preprocessing the signals collected by proton magnetic resonance spectroscopy to obtain the original signal sequence of proton magnetic resonance spectroscopy. This step is identical with the operation process of embodiment 1, Image 6 It is the original signal sequence diagram of the proton magnetic resonance spectrum in this embodiment.
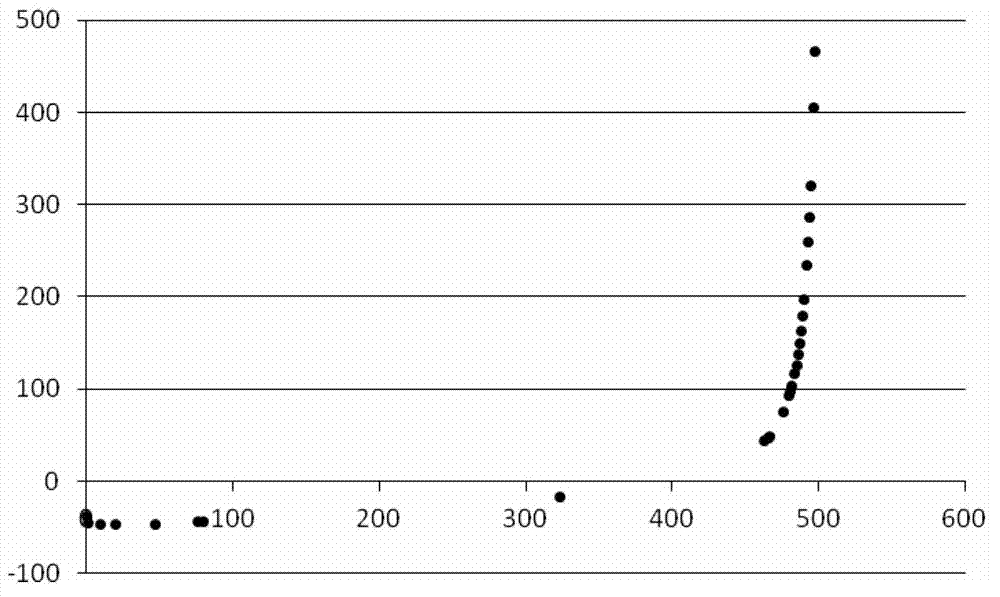
[0098] Step 2: extracting the characteristic points of the frequency spectrum distribution of the water peak in the original signal sequence of the proton magnetic resonance spectrum to obtain a sequence of characteristic points of the frequency spectrum distribution of the water peak.
[0099] In this embodiment, the broken line approximation method is used when obtaining the sequence of fe...
Embodiment 3
[0118] Example 3: Analysis of multi-voxel water film (Phantom) data by using the downward convex function detection method.
[0119] The data was collected from a Siemens 3T nuclear magnetic resonance machine. The scan sequence parameters used were TE=30ms, TR=1700ms, the center frequency was 123.242MHz, the sampling interval was 666ms, and the number of data collection points was 1024. The time-domain real part waveform of the original MRS signal is as follows Figure 11 shown. The real part of the spectrum after the complex Fourier transform is as follows Figure 12 As shown, the enlarged picture is as Figure 13 as shown, Figure 14 It shows the MRS spectrum peak results that can be used for quantitative analysis of compounds obtained after processing with the invention of the technology, Figure 15 for batch processing results.
PUM
 Abstract
Description
Claims
Application Information
 - R&D
- Intellectual Property
- Life Sciences
- Materials
- Tech Scout
- Unparalleled Data Quality
- Higher Quality Content
- 60% Fewer Hallucinations
Browse by: Latest US Patents, China's latest patents, Technical Efficacy Thesaurus, Application Domain, Technology Topic, Popular Technical Reports.
© 2025 PatSnap. All rights reserved.Legal|Privacy policy|Modern Slavery Act Transparency Statement|Sitemap|About US| Contact US: help@patsnap.com


