Method for identifying transmission line parameters
A transmission line and parameter identification technology, applied in the direction of electrical digital data processing, special data processing applications, instruments, etc., can solve the problems of complex transmission line parameters, inaccurate transmission line parameters, and inability to reflect line parameters, etc.
- Summary
- Abstract
- Description
- Claims
- Application Information
AI Technical Summary
Problems solved by technology
Method used
Image
Examples
Embodiment 1
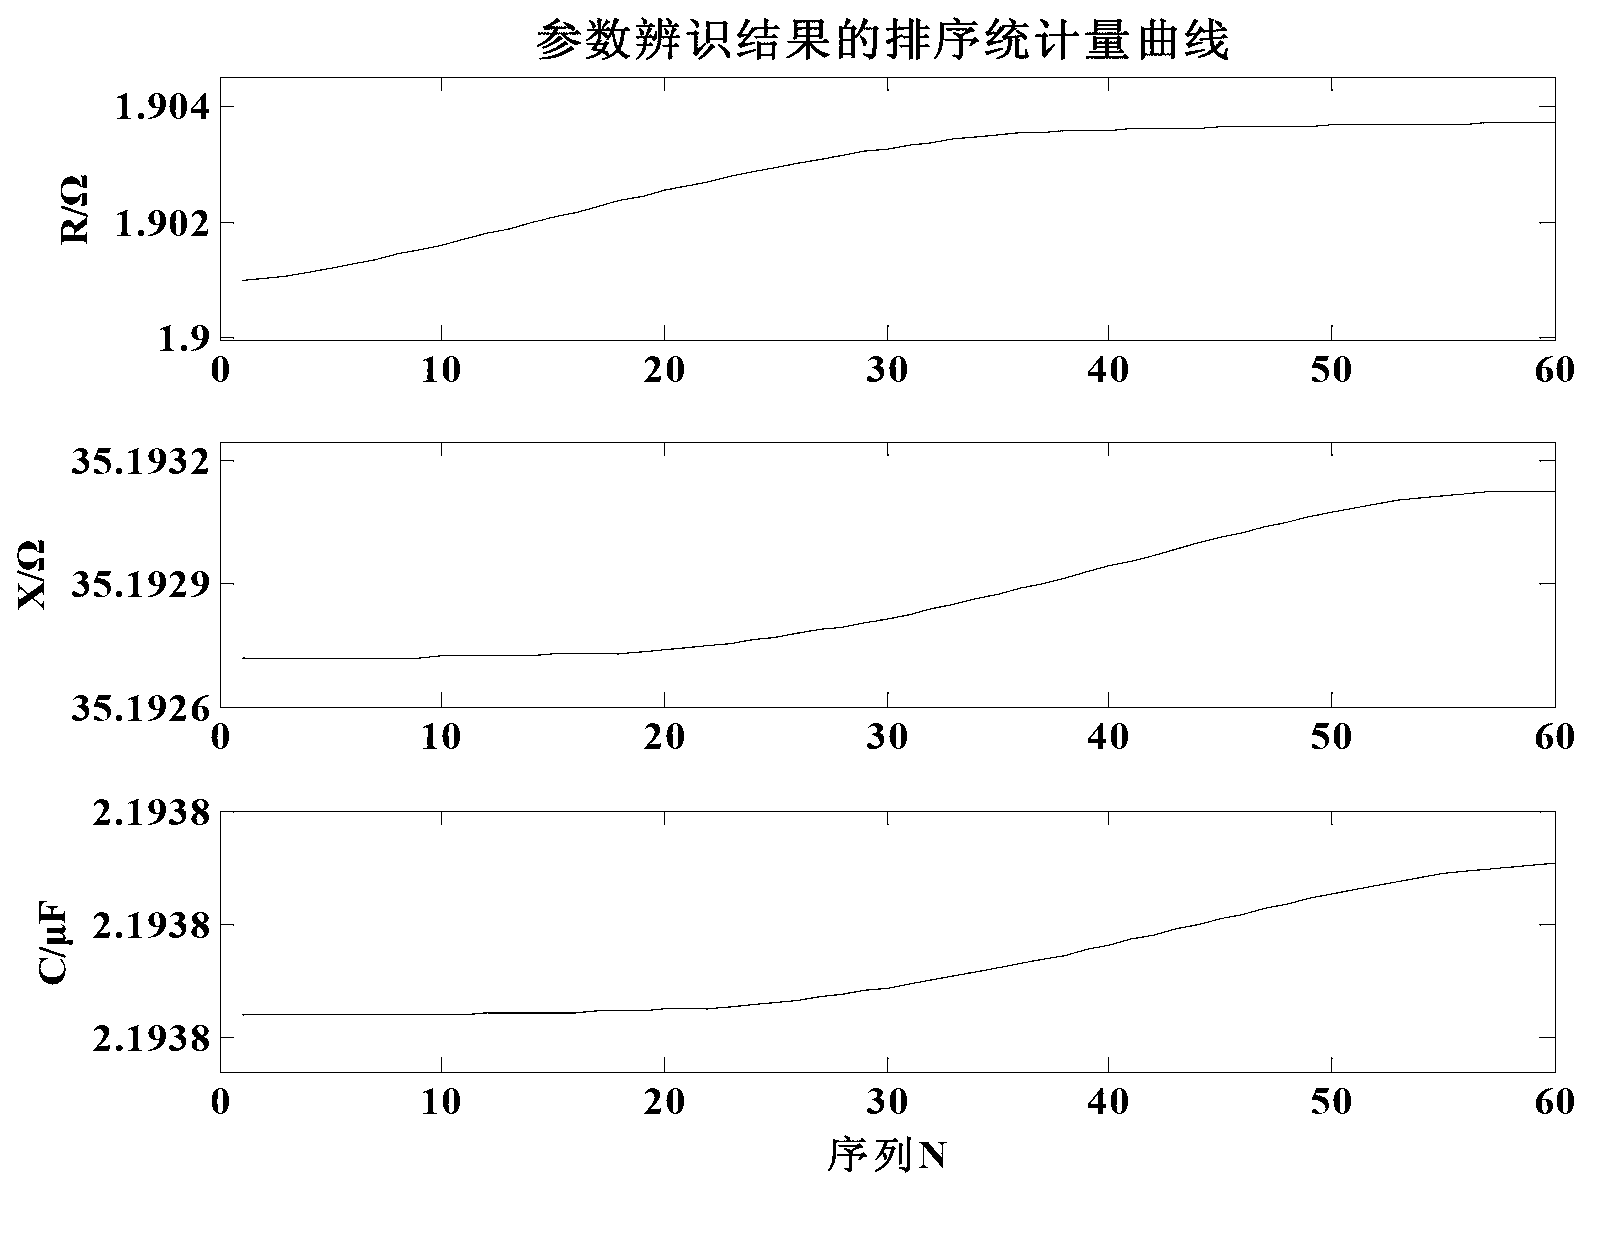
[0068] In this embodiment 1, a single-circuit 500KV transmission line is built in PSCAD, and the line parameters are set as resistance R=1.916Ω, reactance X=35.180Ω, and all ground capacitance C=2.193uF. The voltage and current vectors, active power and reactive power at both ends of the line are measured as PMU quantities, with a sampling interval of 10ms and a total of 600 sets of data for 6s sampling to identify line parameters. Each data window contains 10 sets of sampling data, a total of 60 data windows.
[0069] Such as image 3 Shown is a schematic diagram of sorting statistics of the line parameter identification results based on PSCAD simulation data in Embodiment 1 of the present invention, and the identification results of each parameter based on median estimation and mean estimation are shown in Table 1 below:
[0070] Table 1
[0071]
[0072] From the results of the two estimates in Table 1 above, it can be seen that when there is no measurement error in th...
Embodiment 2
[0083] In this embodiment, the PMU measured data of a 500KV transmission line of a power grid is used for parameter identification. The 500KV line is a double circuit line. The length of this circuit line is 115.8km. Ground capacitance C=1.505uF. There are two time periods of PMU steady-state data, the measurement error of PMU is relatively small, and the sampling interval is 10ms. The data of each period is 6s, a total of 600 sets of data to identify line parameters; each data window contains 10 sets of sampling data, a total of 60 data windows.
[0084] Such as Figure 5 Shown is a schematic diagram of sorting statistics of line parameter identification results based on PMU measured data in Embodiment 2 of the present invention, and the identification results of each parameter based on median estimation and mean estimation are shown in Table 4 below:
[0085] Table 4
[0086]
[0087] From the identification results based on the PMU measured data in Table 4 above, it ...
PUM
| Property | Measurement | Unit |
|---|---|---|
| Resistance | aaaaa | aaaaa |
Abstract
Description
Claims
Application Information
 - R&D
- Intellectual Property
- Life Sciences
- Materials
- Tech Scout
- Unparalleled Data Quality
- Higher Quality Content
- 60% Fewer Hallucinations
Browse by: Latest US Patents, China's latest patents, Technical Efficacy Thesaurus, Application Domain, Technology Topic, Popular Technical Reports.
© 2025 PatSnap. All rights reserved.Legal|Privacy policy|Modern Slavery Act Transparency Statement|Sitemap|About US| Contact US: help@patsnap.com


