Method for detecting sulfide ions
A sulfide ion and linear regression equation technology, applied in the field of sulfide ion detection, can solve the problems of cumbersome detection process and achieve the effect of simple detection means, high sensitivity and selectivity, and low cost
- Summary
- Abstract
- Description
- Claims
- Application Information
AI Technical Summary
Problems solved by technology
Method used
Image
Examples
Embodiment 1
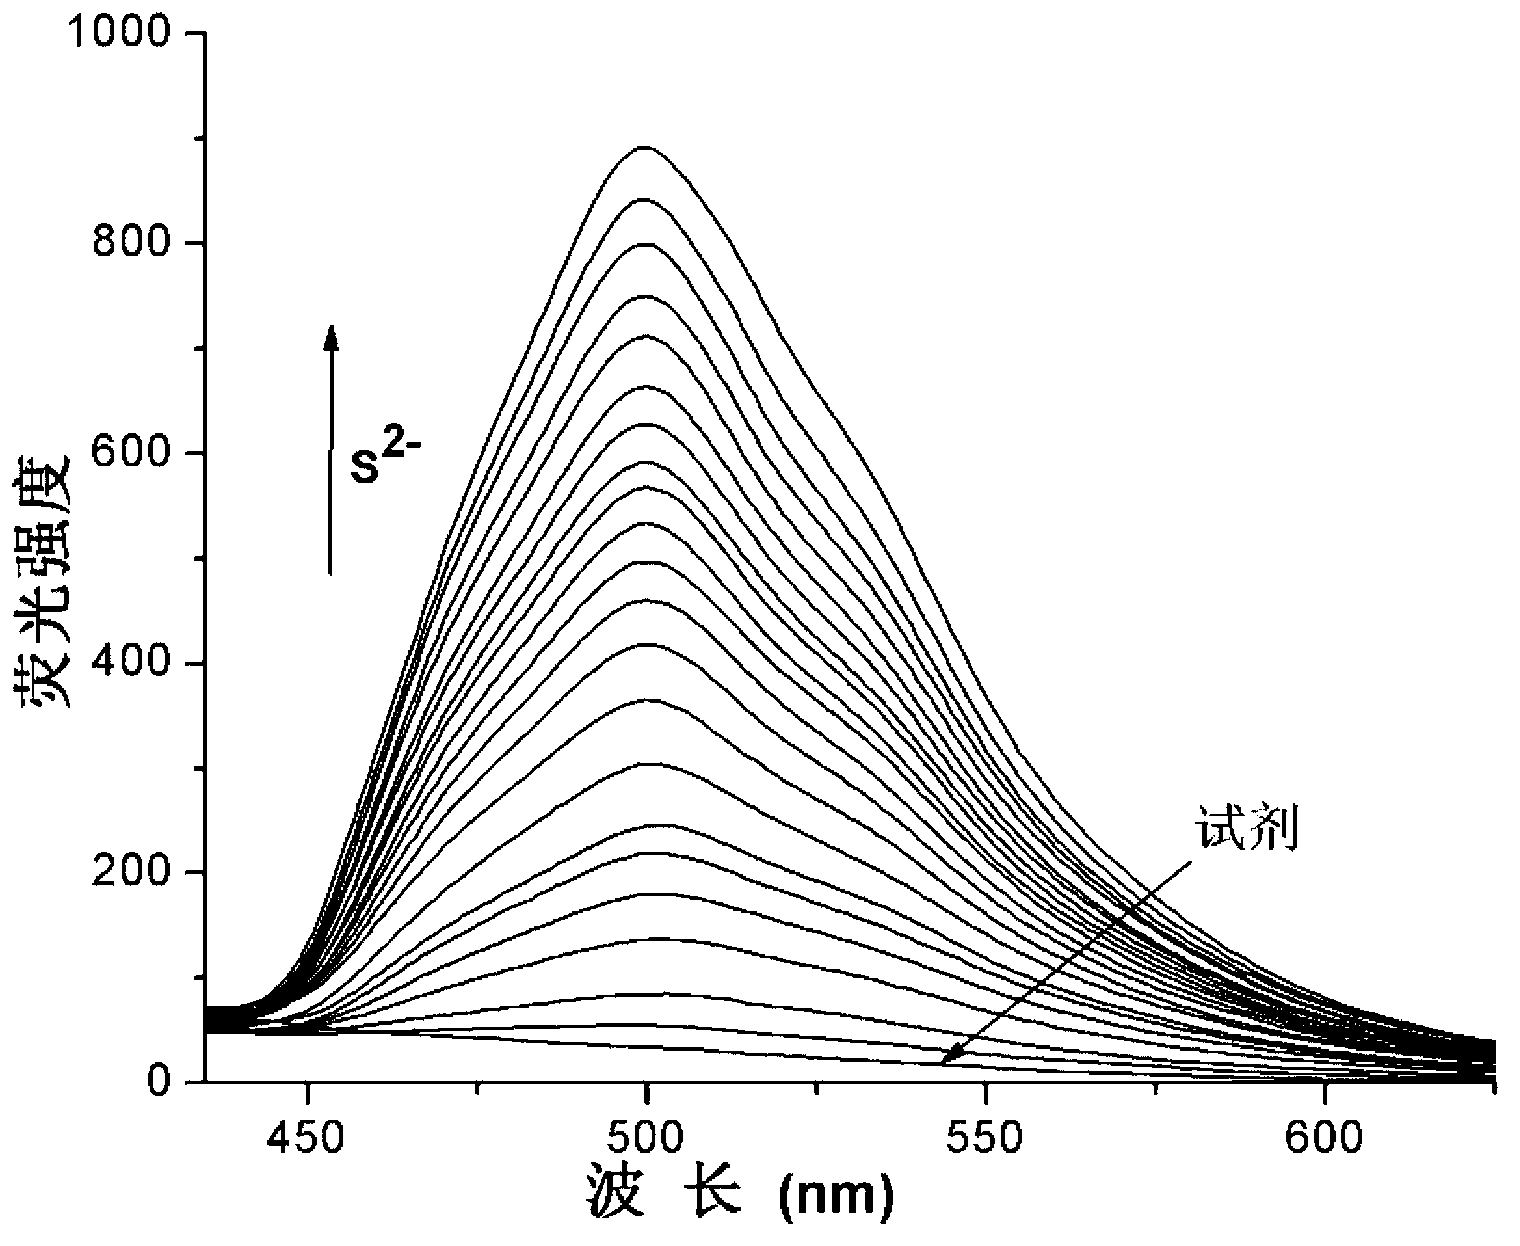
[0019] Prepare a HEPES buffer solution with a pH of 7.0 and a concentration of 10 mM, and prepare a 2 mM perylene-3,4,9,10-tetracarboxylic dianhydride solution with DMSO; mix 2 mL of HEPES buffer solution and 10 μL of perylene-3,4, Add 9,10-tetracarboxylic dianhydride DMSO solution to a clean fluorescence cuvette, take S 2– The solution is gradually added to the cuvette with a micro-injector, and is detected on the fluorescence spectrophotometer while adding the sample. 2– The addition of , the fluorescence intensity at 499nm gradually increased. Fluorescence emission map see figure 1 .
Embodiment 2
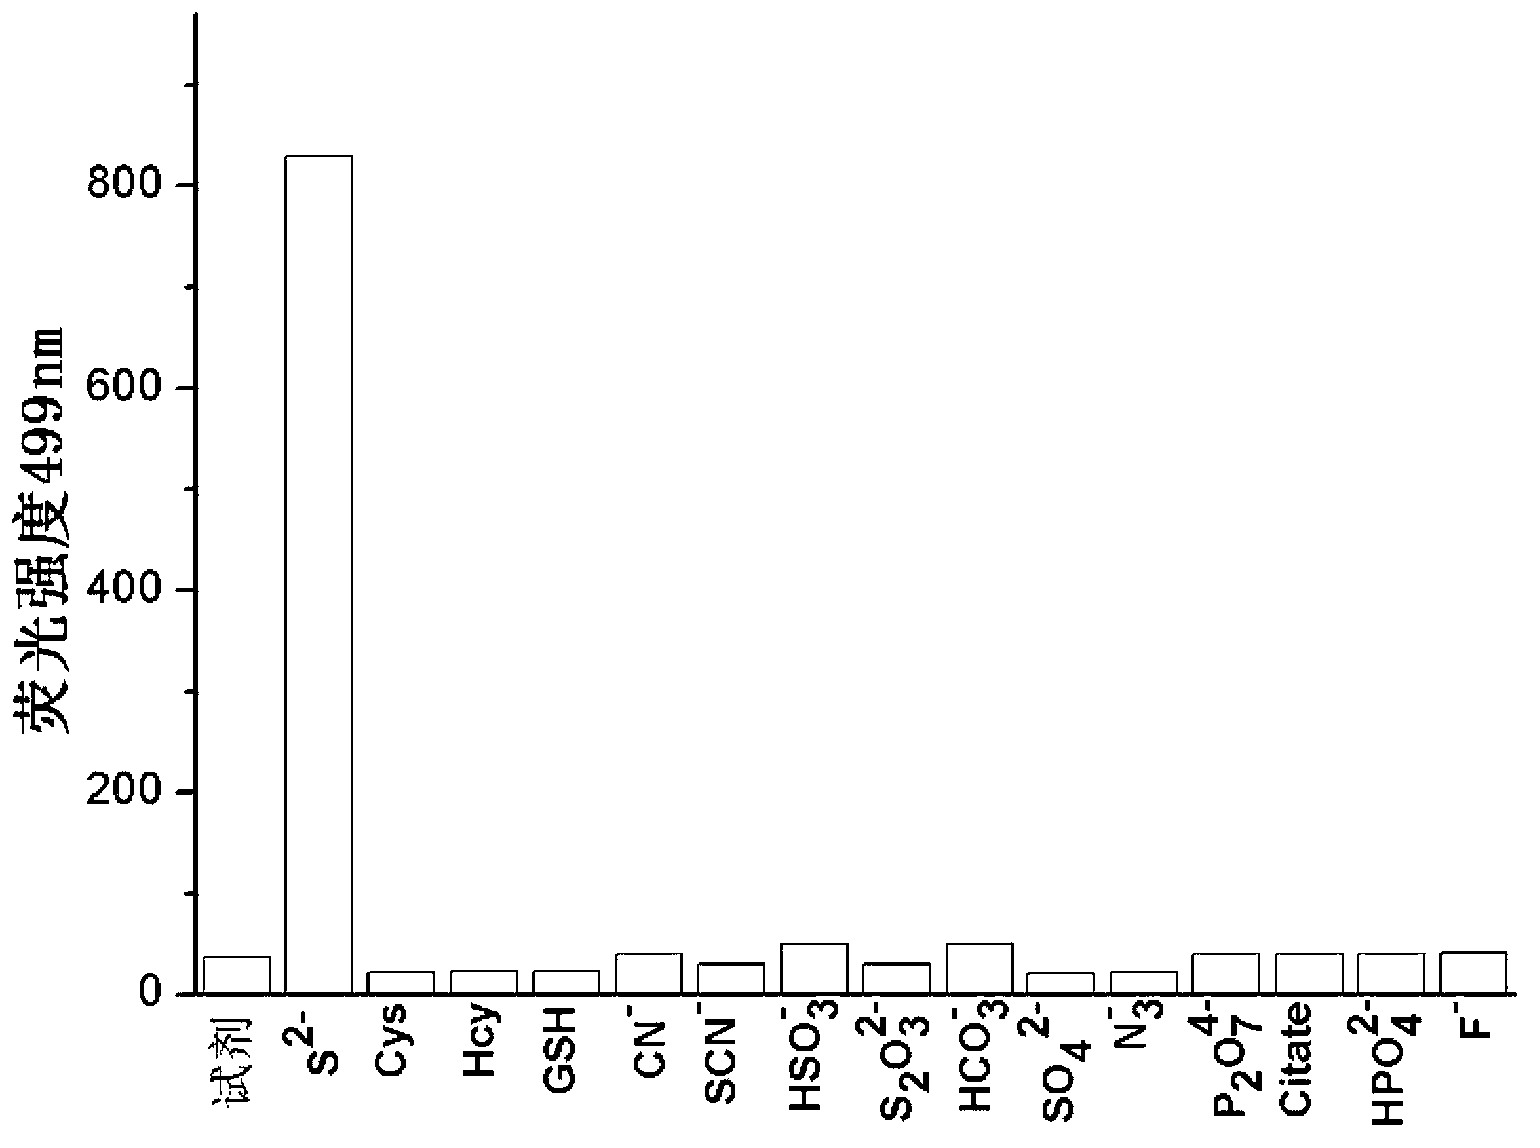
[0021] Prepare a HEPES buffer solution with a pH of 7.0 and a concentration of 10 mM, and prepare a 2 mM perylene-3,4,9,10-tetracarboxylic dianhydride solution with DMSO; add 2 mL of HEPES buffer to each of the 15 fluorescent cuvettes solution and 10 μL perylene-3,4,9,10-tetracarboxylic dianhydride DMSO solution, and then add 20 molar equivalents of S 2– , and 100 molar equivalents of various other analytes: Cys, Hcy, GSH, CN – ,SCN – , HSO 3 – , HCO 3 – , SO 4 2– ,N 3 – ,P 2 o 7 4– , citrate, HPO 4 2– ,F – , detected on a fluorescence spectrophotometer, draw the histogram of the 499nm fluorescence intensity corresponding to different analytes, and obtain the fluorescence emission diagram (see figure 2 ). S 2– The fluorescence intensity of perylene-3,4,9,10-tetracarboxylic dianhydride changed from 35 to about 830, and other analytes basically did not cause the fluorescence intensity of perylene-3,4,9,10-tetracarboxylic dianhydride The change.
[0022] It ha...
Embodiment 3
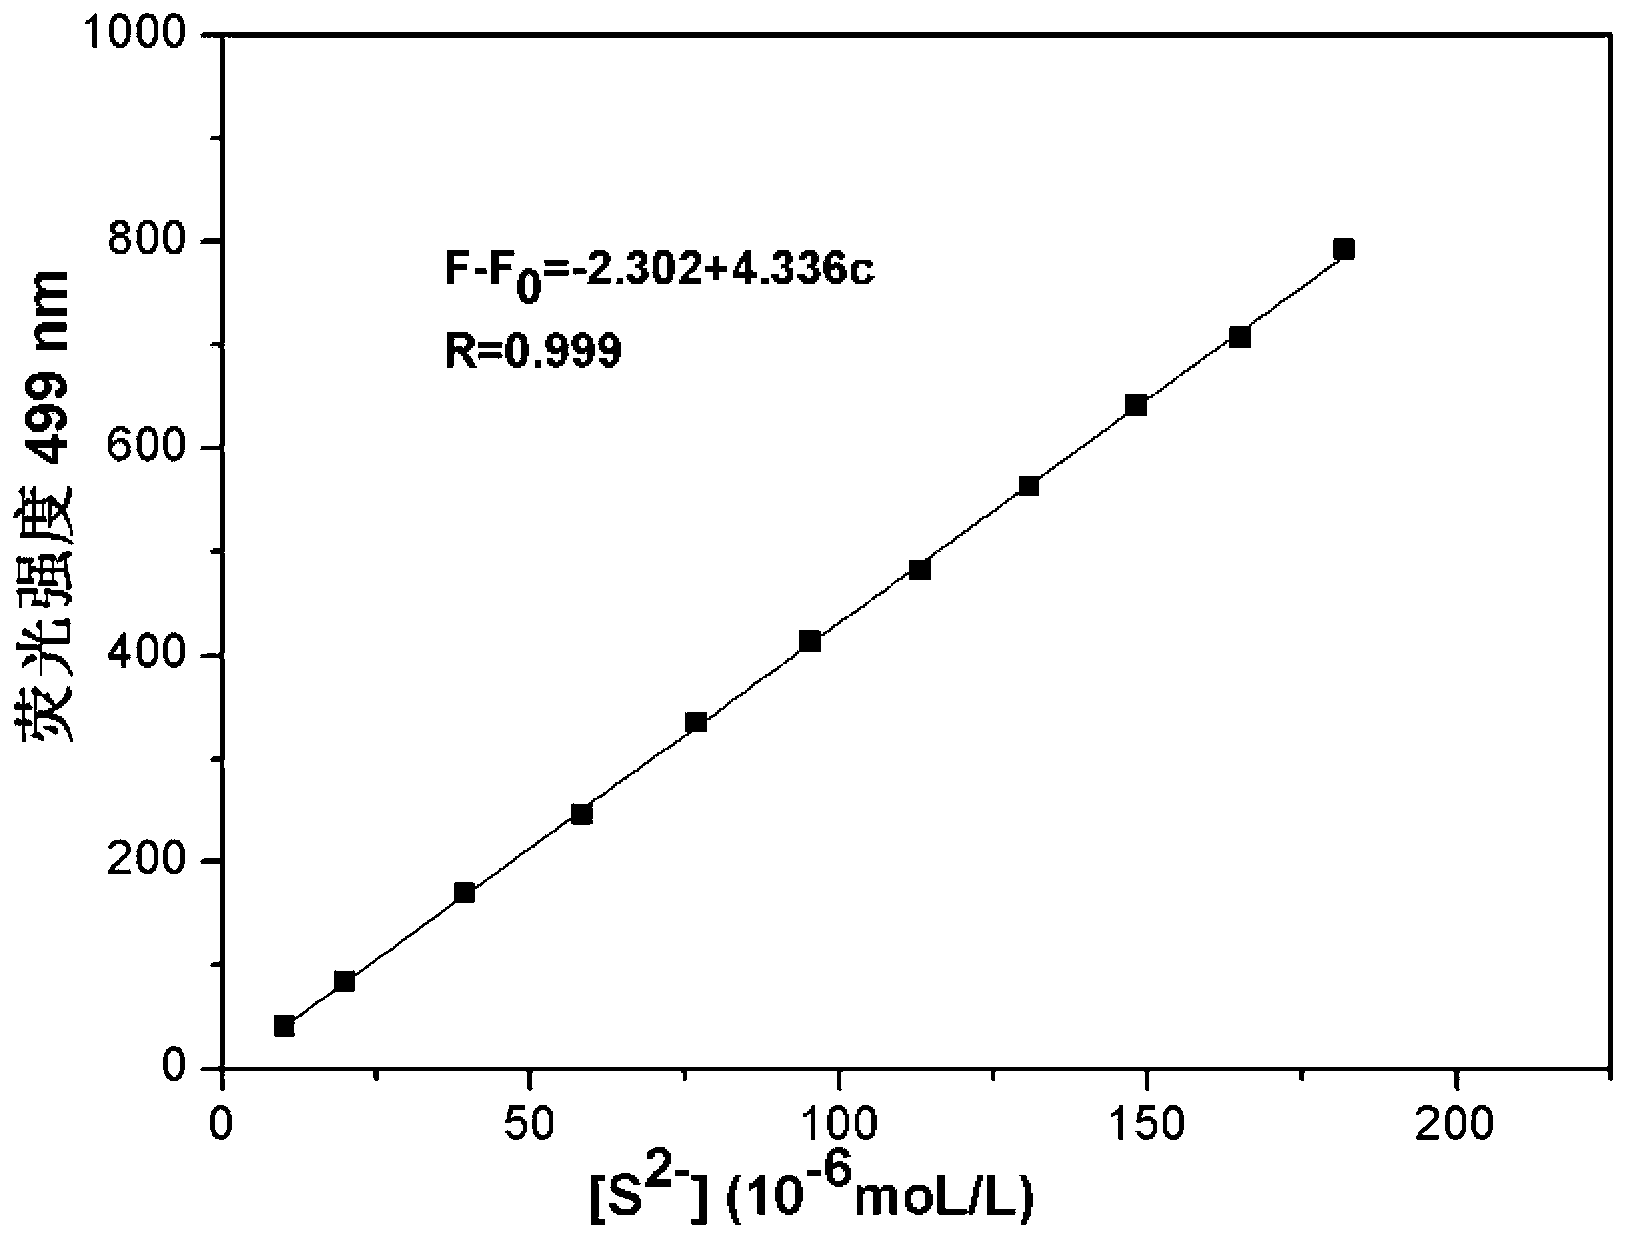
[0024] Prepare a HEPES buffer solution with a pH of 7.0 and a concentration of 10 mM, prepare a 2 mM perylene-3,4,9,10-tetracarboxylic dianhydride solution with DMSO, and prepare a 2 mM S 2– solution; add 2mL of HEPES buffer solution and 10μL of perylene-3,4,9,10-tetracarboxylic dianhydride DMSO solution to the fluorescence cuvette, add S 2– When the volume of the solution is 10, 20, 40, 60, 80, 100, 120, 140, 160, 180, 200μL, the fluorescence intensity F corresponding to 499nm measured on a fluorescence spectrophotometer is 76, 119, 205, 281, 370 , 448, 517, 599, 677, 742, 828, with S 2- The concentration is the abscissa, and the relative fluorescence intensity F-F 0 Plot the graph for the ordinate, F 0 ﹦35, get S 2– Concentration working curve (see image 3 ); the linear regression equation is: F-F 0 =-2.302+4.336c, the unit of c is 10 -6 mol / L.
PUM
 Abstract
Description
Claims
Application Information
 - R&D
- Intellectual Property
- Life Sciences
- Materials
- Tech Scout
- Unparalleled Data Quality
- Higher Quality Content
- 60% Fewer Hallucinations
Browse by: Latest US Patents, China's latest patents, Technical Efficacy Thesaurus, Application Domain, Technology Topic, Popular Technical Reports.
© 2025 PatSnap. All rights reserved.Legal|Privacy policy|Modern Slavery Act Transparency Statement|Sitemap|About US| Contact US: help@patsnap.com


