

Cross calibration method used for online beam monitoring detector in three-dimensional spot scanning beam distribution
A calibration method and detector technology, applied in instruments, measuring devices, scientific instruments, etc., can solve problems such as large uncertainty and systematic errors, too many equipment and detectors, and cumbersome processes, and achieve accurate implementation, improvement and improvement. Distribution technology, the effect of improving work efficiency
- Summary
- Abstract
- Description
- Claims
- Application Information
AI Technical Summary
Problems solved by technology
Method used
Image

Examples
Embodiment 1
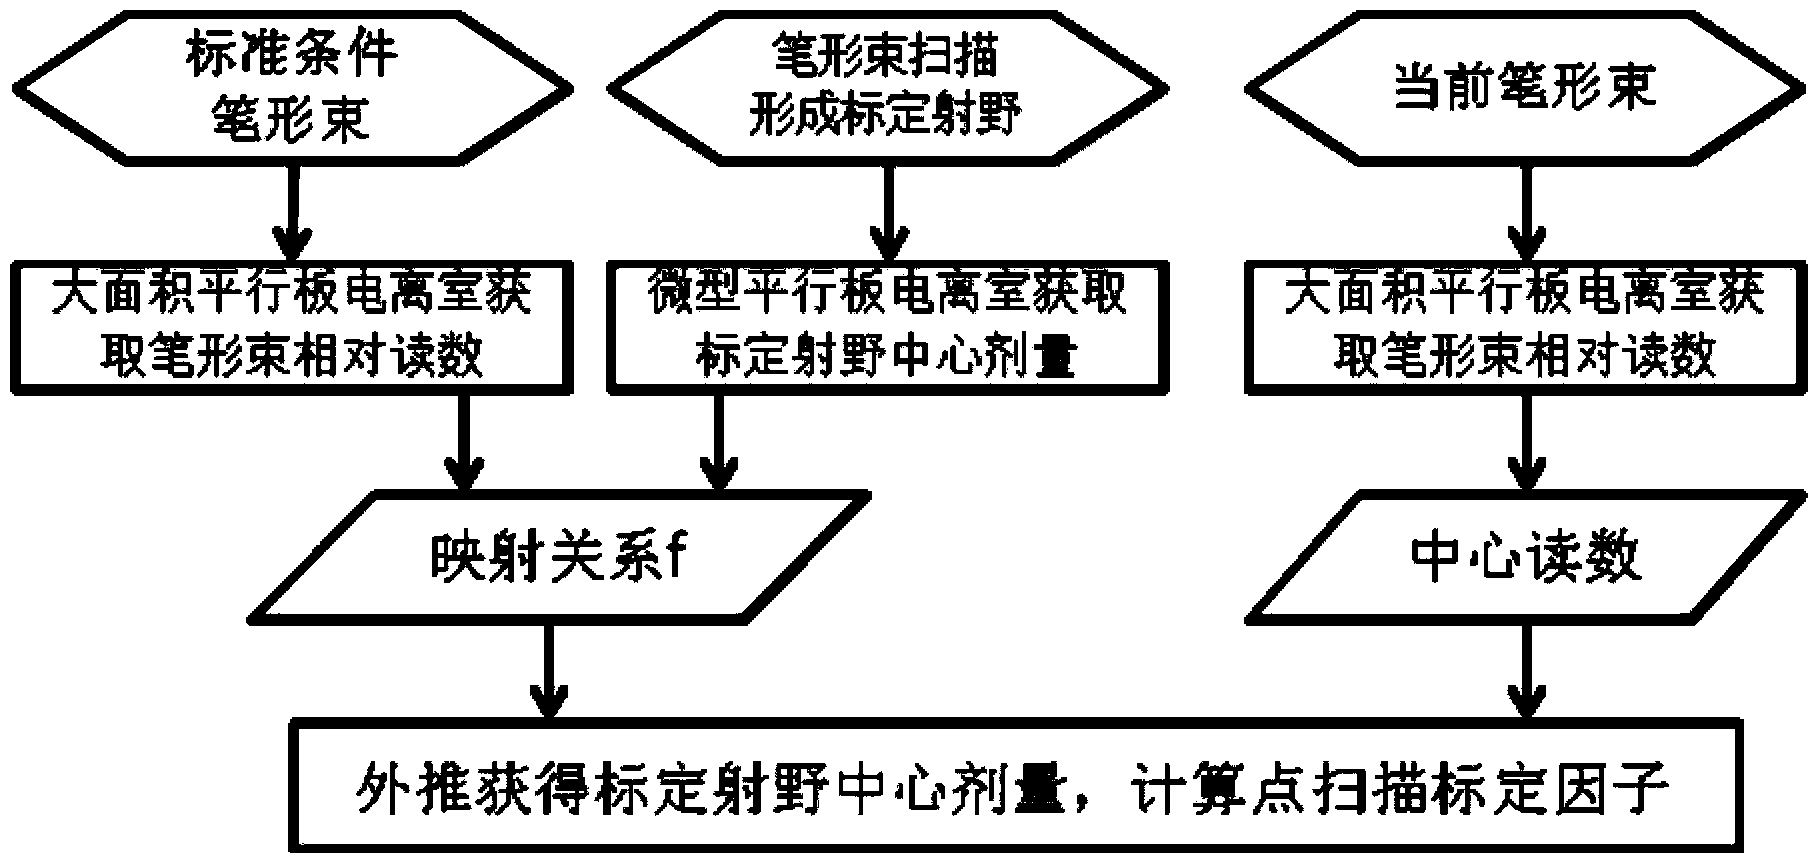
[0042] Example 1: see figure 1 , figure 2 with image 3 , a method for cross-calibrating online beam monitoring detectors in three-dimensional point scanning beam distribution, comprising the following steps:
[0043] (1) Measure the response of a large-area parallel-plate ionization chamber to a single-energy pencil beam with an energy of 250 MeV / u using the parallel-plate ionization chamber Bragg Peak Chamber 34070 produced by PTW (the detector’s sensitive volume diameter is 8.4cm);
[0044] When measuring, set a set of fixed count MU (1×10 4 , 2×10 4 , 3×10 4 , 4×10 4 ), the measured readings in the dosimeter were 8.86, 18.86, 28.86, 38.86 when the single-energy pencil beam acted on the large-area parallel-plate ionization chamber in sequence, and recorded as the central reading D spot ; for experimental setup, see figure 2 .
[0045] (2) According to the fixed counting MU set in step (1), scan point by point at the incident depth of 6.8mm to form a calibration fi...
Embodiment 2
[0057] Example 2: see figure 1 , the center reading D spot with center dose D center The establishment of the mapping relationship between them is realized by analyzing the response data of the large-area parallel-plate ionization chamber 4 to the ion pencil beam 1 and the response data of the miniature sensitive volume ionization chamber 5 to the dose calibration field 7 under consistent conditions to establish a standard relational database. .
Embodiment 3
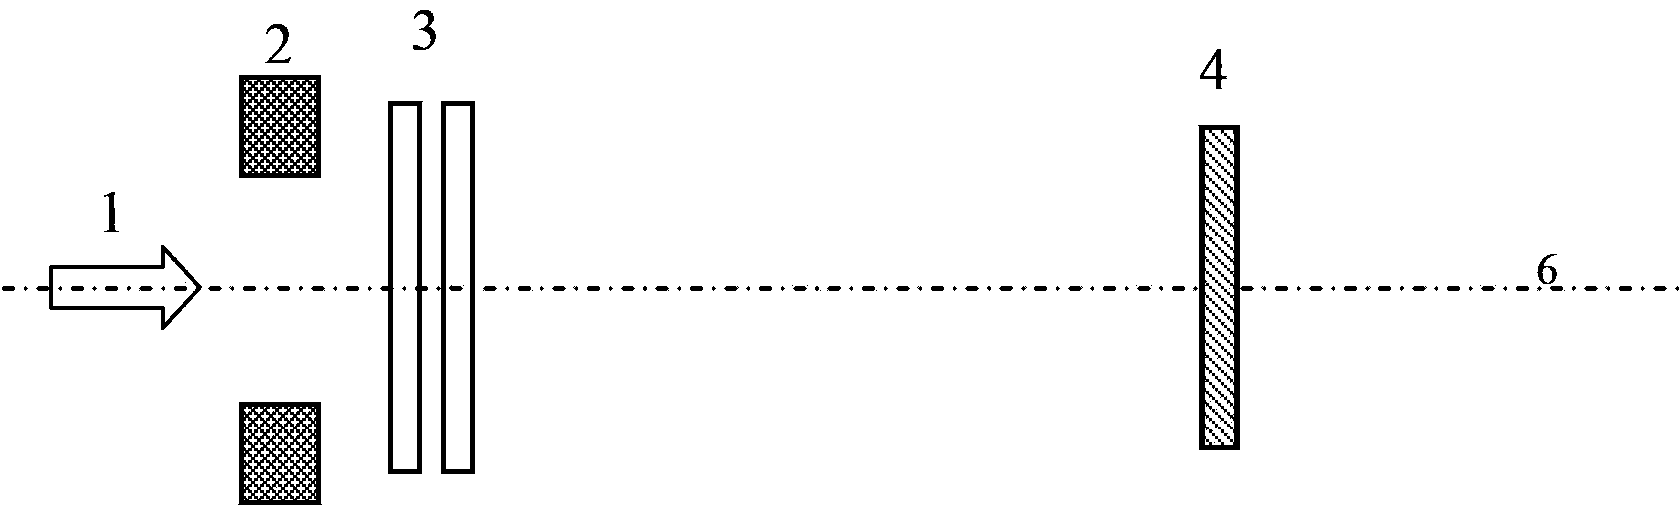
[0058] Embodiment 3: see figure 2 , the described large-area parallel plate ionization chamber 4 measuring single-energy pencil beam 1 device includes a scanning magnet 2 located at the downstream of the single-energy pencil beam 1, to control and ensure that the single-energy pencil beam 1 moves along the beam flow line For collimated distribution, an online monitoring detector 3 is installed on the beam axis 6, and a large-area parallel plate ionization chamber 4 is installed at the end of the beam axis 6. It is required to ensure that the beam passes through the online monitoring detector 3 along the beam axis 6 and irradiates vertically to the large-area parallel plate ionization chamber 4 .
PUM
 Abstract
Description
Claims
Application Information