Method for evaluating flow pattern of constructed wetlands by using hydrogen or oxygen isotopic abundance

A technology of isotopic abundance and oxygen isotope, which is applied in fluid dynamics tests, testing of machine/structural components, instruments, etc., to achieve the effect of strong practicability, lower cost and less time-consuming

Active Publication Date: 2014-01-29
SHANDONG UNIV
View PDF3 Cites 7 Cited by
  • Summary
  • Abstract
  • Description
  • Claims
  • Application Information

AI Technical Summary

Problems solved by technology

[0005] Aiming at the deficiencies in the current research on the water flow state and hydraulic characteristics of the constructed wetland, the present invention proposes a high-accuracy, simple and convenient method

Method used


Image

  • Method for evaluating flow pattern of constructed wetlands by using hydrogen or oxygen isotopic abundance
  • Method for evaluating flow pattern of constructed wetlands by using hydrogen or oxygen isotopic abundance

Examples


Embodiment 1

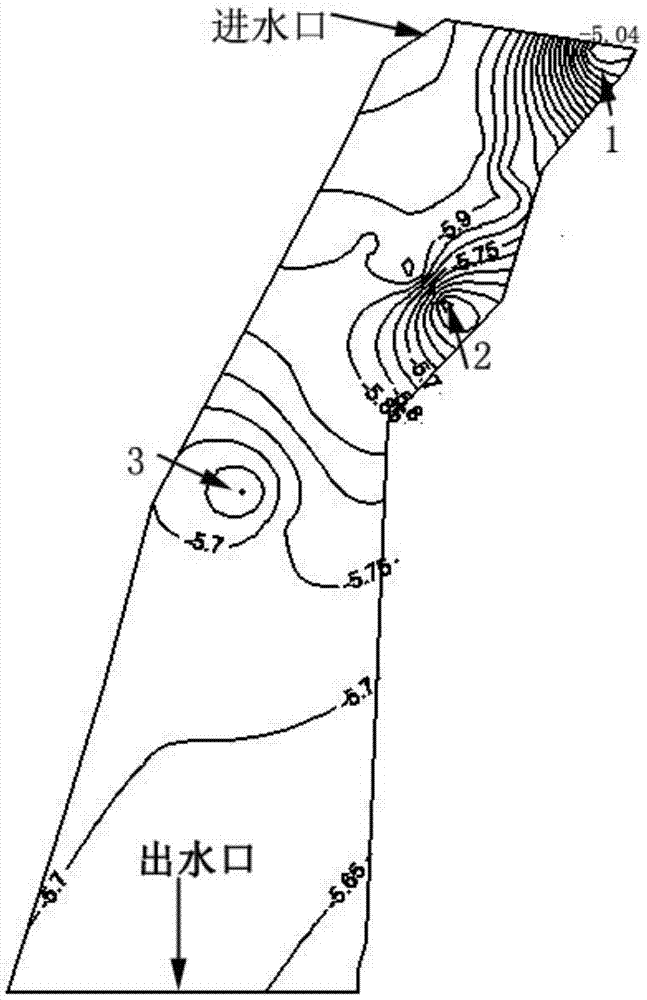
[0014] The wetland system to be tested is an area with an area of ​​100-10,000 mu, and the location of the sampling points on this water area is determined by the grid point method. Determine the monitoring section along the direction of water flow. The distance between each monitoring section is generally between 100-300m. When the width of the monitoring section is less than 50m, only one sampling point is determined in the middle of the section; Two sampling points are set at 10-30m near the shore; when the water surface width is 100-1000m, three sampling points are set at the left, middle and right. Reinforce placement in areas where short or slow currents are likely to exist. Sampling in weather with no wind and low humidity, use GPS to locate each sampling point, use a water sampler to collect 100ml of 3 mixed water samples at 20-30cm below the water surface at each sampling point, and place the water samples in plastic Store the vials at low temperature and away from l...

Embodiment 2

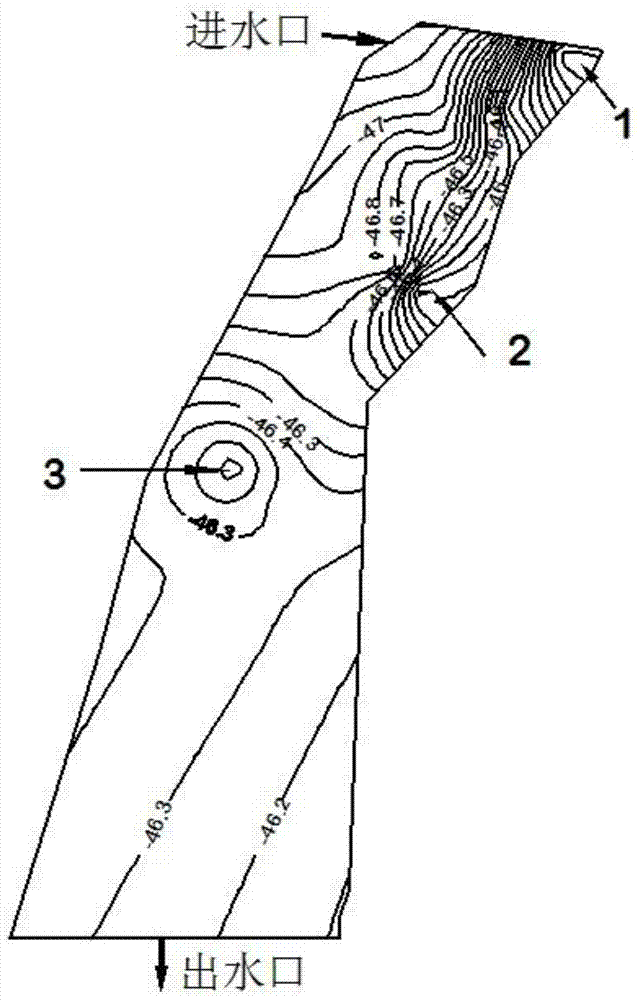
[0016] Determine the locations of plant sampling points in the monitored wetlands. The determination of the sampling points is the same as in Example 1. About 100 g of plant leaves are collected at each sampling point, placed in a sample bag, refrigerated and protected from light, and brought back to the laboratory. Vacuum distillation was used to extract water from plant leaves to obtain water samples to be tested. After the water samples passed through a 0.22 μm filter membrane, the abundance of hydrogen or oxygen isotopes was measured with a Picarro water isotope analyzer. Draw the isotope abundance contour line of the area to be evaluated according to the data of the sampling points obtained from the measurement. According to the isotope contour line, 2 H or 18 The area with high O abundance and obvious edge with other areas of the wetland is the slow flow area or dead water area, from the water inlet to the water outlet 2 H and 18 The area where the O abundance is relat...

Embodiment 3

[0018] Determine the location of plant sampling points in the monitoring wetland. The determination of sampling points is the same as in Example 1. About 100 g of plant roots are collected at each sampling point. The test and analysis method is the same as in Example 2.


PUM


Abstract

The invention belongs to the technical field of environmental monitoring, and particularly relates to a method for evaluating a flow pattern of constructed wetlands by using hydrogen or oxygen isotopic abundance. The method includes that contour line of the isotopic abundance of an area to be evaluated is drawn according to sampling point data obtained through measurement, and 2H (hydrogen) and 18O(oxygen) abundances are higher based on isotopic contour line. And an area forming obvious edges with other areas of the wetlands is a slow flow area or a dead water area, 2H and 18O abundances are relatively lower, and an area with little variation is a water flow passage of the wetlands. By the aid of the method, specific positions of the water flow passage and a stagnant area in the wetlands can be accurately marked, slow flow level is determined, limitation of a tracer agent adding research method and model simulation is overcome, the method is simple in sample preprocessing analysis, real and reliable in data results, and high in practicability.

Description

1. Technical field [0001] The invention belongs to the technical field of environmental monitoring, and in particular relates to a method for monitoring and evaluating the flow state of constructed wetlands. 2. Background technology [0002] As a sewage ecological treatment process, constructed wetland has been widely used in domestic sewage, storm runoff, tail water treatment of sewage treatment plants, and river and lake treatment due to its advantages of low investment, low energy consumption, good effect, and simple maintenance and management. Pollution Prevention. [0003] The flow state and hydraulic characteristics of the water body in the constructed wetland are an important factor to maintain the normal operation of the wetland system and give full play to the purification effect. The water flow patterns in the wetland system are relatively diverse, there are stagnation and short-flow phenomena, and some areas may not be fully utilized. Therefore, assessing the wa...

Claims


Application Information

Patent Timeline
IPC IPC(8): G01M10/00
Inventor 张建王洪秀张成禄冯素萍郭子彰程呈
Owner SHANDONG UNIV
Why Eureka
Try Eureka