New method for pump diagram metering stability

A technology of pump power diagram and new method, which is applied in measurement, calculation, earthwork drilling and production, etc., and can solve problems such as low precision, impracticality, and small number of oil wells

Active Publication Date: 2015-04-08
贵州航天凯山石油仪器有限公司 +1
View PDF3 Cites 6 Cited by
  • Summary
  • Abstract
  • Description
  • Claims
  • Application Information

AI Technical Summary

Problems solved by technology

[0003] At present, the production calculation using the gong diagram method mainly uses the daily liquid production measurement results to judge the production of a single well. There are no reports on the stability of online calculations for different oil wells. That is, to explore an online stable production measurement pump suitable for oil wells in different geological formations. The power diagram measurement method, that is to say, requires that this method should not have jumping changes in the opening and closing points of the pump under the condition that the pump power diagram does not change significantly.
The outstanding defects of the existing work diagram measurement methods (such as the wire drawing method, the area method, the iterative method, and the effective stroke method): (1) poor universality and sensitivity to oil well parameters; (2) valve opening and closing The point is that when the pump power diagram does not change significantly, the jump is serious, and the measurement deviation of liquid production is large; (3) the number of oil wells involved is small, and the production efficiency is low
[0005] 1) The position of each point on the pump power diagram is complex and changeable. Using the curve fitting method to simulate the shape of the local area of ​​each position B and D, on the one hand, the amount of calculation is large; The accuracy of the point is low; 2) The idea of ​​determining points A and B does not consider the typical characteristics of these two points in the pump power diagram, and directly locates point A at the leftmost end of the pump power diagram, and positions point C at the extreme left of the pump power diagram. Right end, which is impractical and not approved by the oil field
In most cases, point A is the first convex point in the curve segment along the leftmost endpoint on the pump diagram, and point C is the first convex point in the curve segment along the leftmost endpoint on the pump diagram; Therefore, such simple handling of points A and C will inevitably lead to low measurement accuracy and poor stability; 3) The situation that point D is not a lower convex point is not considered
Therefore, the production efficiency and calculation effect of this method are still not ideal.

Method used


Image

  • New method for pump diagram metering stability
  • New method for pump diagram metering stability
  • New method for pump diagram metering stability

Examples


Embodiment 1

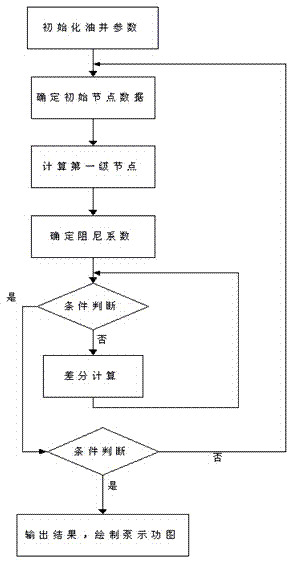
[0065] look first Figure 4 , Figure 4 It is a flow chart of obtaining liquid production by the method of the present invention. In the technical field, the method for calculating production by pump power diagram of rod pumping system consists of three parts: the first part is the formation of pump power diagram, that is, based on ground measurement data 1. Mathematical model and algorithm to generate pump power diagram. The second part is the method of determining the valve opening and closing point. The third part is the measurement of liquid production. These three parts can be connected in sequence to achieve the purpose of production calculation. Among them, the key point of the technical problem to be solved by the present invention lies in the second part, that is, how to determine the opening and closing point of Vers.

[0066] The specific implementation technical scheme of each part is described respectively below:

[0067] (1) Formation of pump power diagram

[...


PUM


Abstract

The invention discloses a new method for pump diagram metering stability. The new method generates a pump diagram on the basis of ground survey data, oil well parameters, mathematical models and algorithms and consists of two parts including a valve opening and closing point initial position determination method and a correction method, wherein the valve opening and closing point initial position determination method is characterized in that a valve opening and closing point initial position is established and directly extracted on the basis of the pump diagram, and the correction method is characterized in that an initial valve opening and closing point is corrected when a moving valve opening and closing point is subjected to a hopping phenomenon under the state of a constant working condition by combining with the shape features of the pump diagram. The combination of the valve opening and closing point initial position determination method and the correction method has the outstanding advantages that the position determination speed of the valve opening and closing point is high, the valve opening and closing point can be accurately positioned, the hopping phenomenon of the position of the valve opening and closing point due to the subtle change of the pump diagram can be effectively avoided, the new method can be applied to the real-time metering production of an oil well group, and metering precision is high.

Description

technical field [0001] The invention relates to the technical field of oil well power map metering and computer measurement and control in an oil field, in particular to a new method for oil well pump power map metering stability in an oil field. Background technique [0002] In the past, the traditional metering methods in most oilfields in my country were mainly carried out through metering rooms and glass tubes. This method has many disadvantages such as high cost and low efficiency. The power diagram method is based on the working principle of the pumping well, using the collected surface dynamometer diagram of the oil well, combined with key information such as the basic parameters of the oil well, dynamic parameters, etc. to calculate the downhole pump power diagram, determine the effective stroke, and calculate the fluid production of the oil well. With the advancement of digital construction of oilfields and the maturity of software measurement technology, this measu...

Claims


Application Information

Patent Timeline
Patent Type & Authority Applications(China)
IPC IPC(8): G06F19/00E21B47/00
Inventor 张著洪谢雪峰王开明田坤
Owner 贵州航天凯山石油仪器有限公司
Why Eureka
Try Eureka