Plane seismic exploration signal decomposition method based on Kriging method
A technology for seismic exploration and signal decomposition, which is applied in seismic signal processing and other directions, and can solve problems such as reducing the accuracy of direction estimation, and generating false images from mathematical transformation methods of discrete signals.
- Summary
- Abstract
- Description
- Claims
- Application Information
AI Technical Summary
Problems solved by technology
Method used
Image
Examples
Embodiment 1
[0072] A method for decomposing a plane seismic survey signal based on a kriging method, collecting seismic survey signals, includes the following steps:
[0073] While shortening the calculation efficiency of the experimental variogram, the accuracy of the theoretical variogram is guaranteed, the correspondence between the information of each component and the variogram is solved, and the theoretical variogram of the component is determined. The main methods are:
[0074] Sparse sampling to calculate the experimental variogram of plane attributes, and extract the ellipse part corresponding to the target component on the variogram, including: selecting the direction of the long and short axes, determining the range, and using the least squares method to fit the parameters of a one-dimensional linear model to obtain the length and length. The theoretical variogram in the axial direction, on the premise of geometric anisotropy, fits the two-dimensional linear model parameters to ...
Embodiment 2
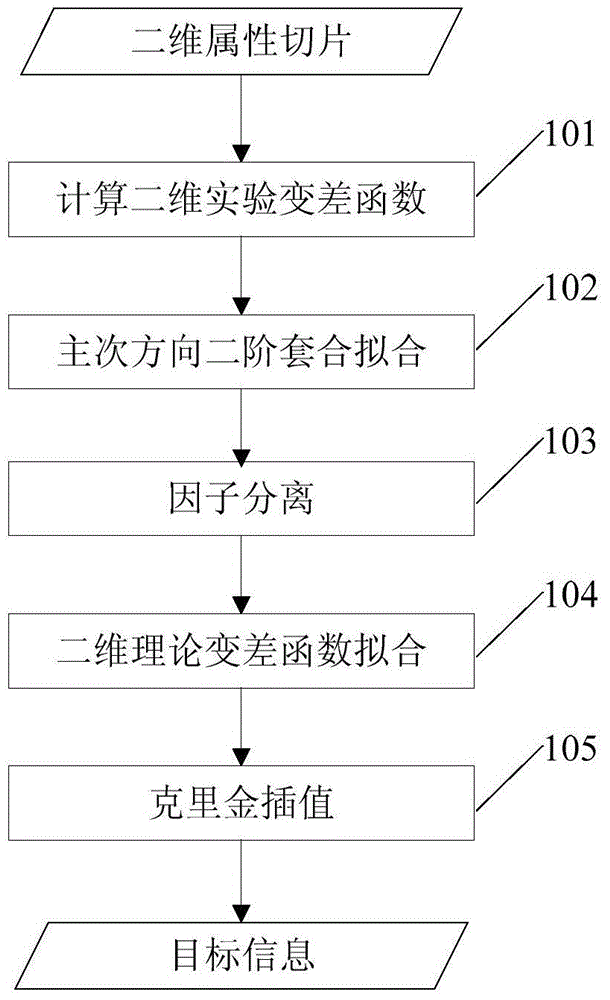
[0106] like figure 1 shown, figure 1 This is a flow chart of the signal decomposition method for plane seismic exploration based on the kriging method of the present invention.
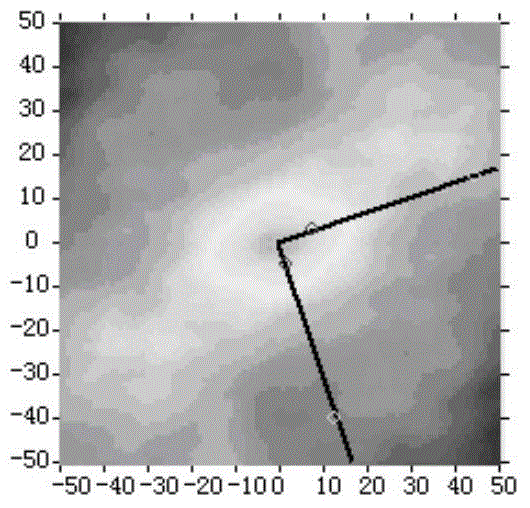
[0107] In step 101, the experimental variogram of the seismic attribute slice is calculated, and the display effect is as follows Figure 2a , and go to step 102 .
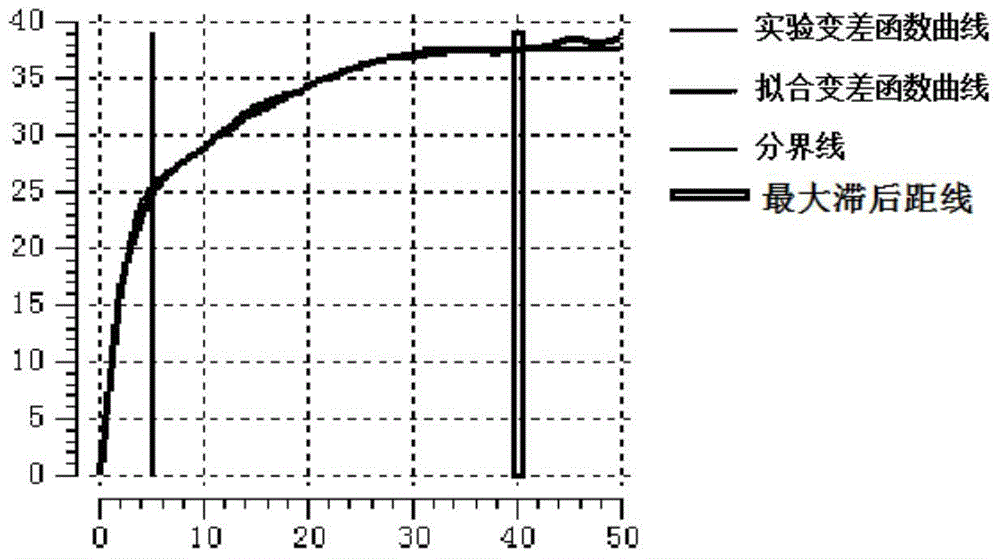
[0108] In step 102, the main direction of the effective information component is selected on the experimental variogram graph, and the experimental variogram curve in the long axis direction is displayed as follows Figure 2b , adjust the maximum lag distance and the demarcation point, select a model for fitting, do the same processing on the short axis, and go to step 103 .
[0109] In step 103, the result of the two-direction fitting in step 102 is displayed as follows Figure 2c , 2d , Figure 2c Corresponding to the long axis, Figure 2d Corresponding to the short axis, and displaying the variogram curves of the three component...
PUM
 Abstract
Description
Claims
Application Information
 - R&D
- Intellectual Property
- Life Sciences
- Materials
- Tech Scout
- Unparalleled Data Quality
- Higher Quality Content
- 60% Fewer Hallucinations
Browse by: Latest US Patents, China's latest patents, Technical Efficacy Thesaurus, Application Domain, Technology Topic, Popular Technical Reports.
© 2025 PatSnap. All rights reserved.Legal|Privacy policy|Modern Slavery Act Transparency Statement|Sitemap|About US| Contact US: help@patsnap.com


