Weld appearance shape based on line laser scanning and surface defect detection method

A technology for defect detection and weld appearance, applied in the direction of optical defect/defect test, measuring device, optical device, etc., can solve the problems of laser recognition difficulty, affecting detection accuracy, interference of normal defect detection, etc., to achieve accurate detection, High-quality weld production and the effect of improving detection efficiency

Inactive Publication Date: 2015-06-10
ZHONGBEI UNIV
4 Cites 52 Cited by

AI-Extracted Technical Summary

Problems solved by technology

Existing laser contour recognition methods cannot provide effective contour recognition to accurately determine the starting position of the weld in width, which causes great difficulties for line laser recognition of weld shape and size (such as weld width) information
In addition, the height difference caused by fish scales on the surface of the weld will also bring difficulties to line laser diagnosis
[0007] 2) In the process of welding seam detection, the instability caused by the movement of the line laser sensor, the inclination and angular deformation of the welding plate, the slight fluctuation and change of the detection height, etc. will affect the detection accuracy, and the above factors must be corrected
However, its correction is af...

Abstract

The invention discloses a weld appearance shape based on line laser scanning and a surface defect detection method. The method comprises the steps of acquiring the actual profile curve of any section of a welded joint by laser; carrying out high-dimensional fitting on the actual profile curve to obtain a fitting profile curve, so as to obtain a first-order derivative curve of the fitting profile curve; determining the addressing ranges of the starting point and the final point of the welded joint by the first-order derivative curve; finding a point which has maximum differential value with the fitting profile curve on the actual profile curve as the starting point and final point of the section of the welded joint to obtain an integrally three-dimensional profile image of the welded joint. The welded joint is deemed to have a defect when a differential value between any point of the profile curve of the welded joint and the fitting profile curve exceeds the preset standard value. According to the detection method provided by the invention, the starting point and the final point of the welded joint can be accurately judged, and various surface defects of the welded joint can be precisely judged.

Application Domain

Technology Topic

Image

  • Weld appearance shape based on line laser scanning and surface defect detection method
  • Weld appearance shape based on line laser scanning and surface defect detection method
  • Weld appearance shape based on line laser scanning and surface defect detection method

Examples

  • Experimental program(1)
  • Effect test(1)

Example Embodiment

[0067] Example 1.
[0068] For ease of description, in this embodiment, the longitudinal direction of the welding seam is set as the Z-axis direction, the cross-sectional direction is the X-axis direction, and the height is set as the Y-axis direction.
[0069] A line laser generator is located in the Y-axis direction of the weld, which can generate a beam of line laser in the X-axis direction, project and focus on the surface of the weld, and scan the cross-section of the weld in the X-axis direction.
[0070] A photodetector images the line laser on the surface of the weld from another angle. Due to the different heights of the line laser irradiation on the surface of the weld, the angle of the scattered or reflected laser light received by the photodetector is also different. For any laser point of the line laser, the photodetector will obtain the position of the spot image, which can be calculated. The position height of the laser irradiation point on the surface of the weld, so as to obtain the height profile of the entire line laser reflection, that is, the initial profile curve of the weld at a certain cross-section. The laser imaging system is controlled by software to read the height and position data of each point on the initial contour curve of the weld, and transmit it to the computer. Through preliminary data processing, the original data of the actual contour curve of the weld section is obtained.
[0071] At the same time, the line laser generator moves along the Z-axis to continuously collect weld profile data of different sections. After combining the data, the original 3D profile image of the weld as a whole can be obtained.
[0072] In the actual inspection of the weld, there may be some influencing factors such as the inclination of the steel plate, or the angle inclination of the line laser, the change of height jitter, and the uneven and stable speed during the movement of the line laser. These factors may cause the actual profile image of the weld section. distortion, which needs to be corrected.
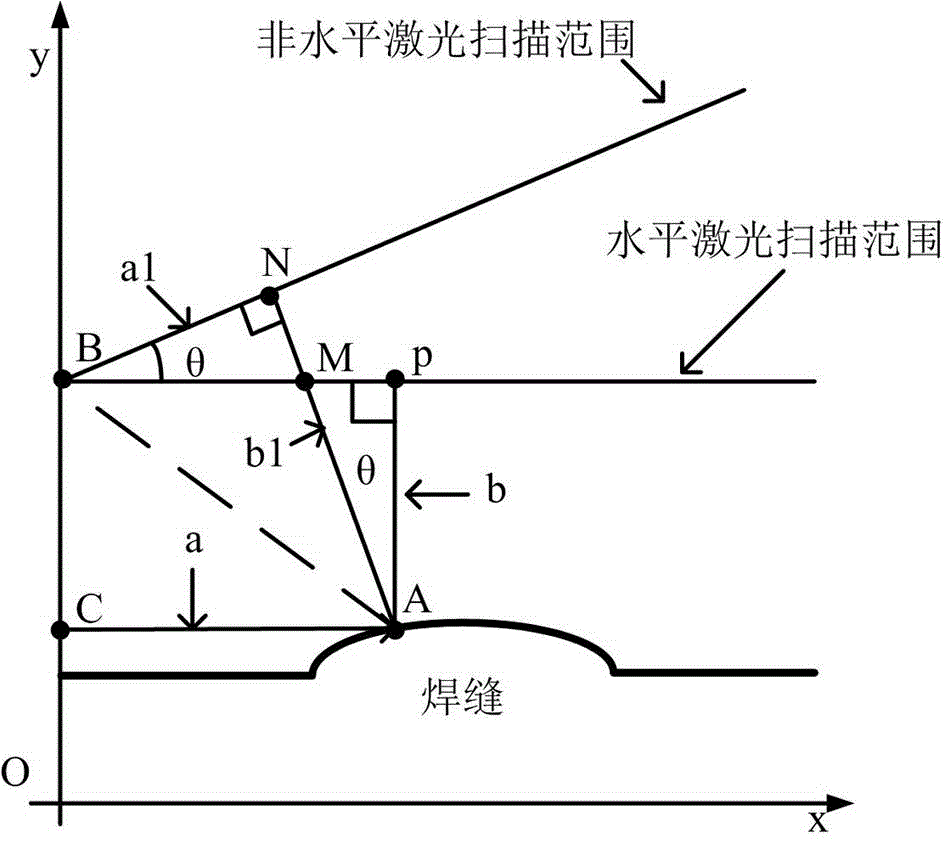
[0073] The first is tilt correction of the weld profile. The obtained original data of the actual profile curve of the weld is only the height data obtained during the detection process, not the real shape of the weld. like figure 2 As shown in the figure, if the line laser generator, the steel plate or the operator's hand is tilted, there will be a reaction on the contour line, the contour of the weld will be "distorted", and the obtained height and point position will change. Therefore, slope correction of the contour is required. The specific method is based on the fact that the points outside the weld are all from the reflection of the steel plate. Therefore, two points are randomly selected along the X-axis direction on the steel plate outside the weld area, and the height value of the two points is measured. According to the difference between the two points The inclination angle θ can be calculated according to the distance and height difference of the welding seam, and the inclination angle can be calculated by taking the inclination angle into the height y and position x of any measurement point on the weld, and the actual height y′ and actual position x′ after the inclination correction can be calculated.
[0074] like figure 2 As shown, assume that A is any point on the weld. When the line laser is normally incident, that is, the vertical incidence, the actual value obtained should be the measured value of height AP (value b) and position AC (value a); and when the line laser is inclined, the obtained height measurement value of point A is becomes AN (the value b 1 ), the position measurement becomes BN (the value a 1 ). The present invention calculates the slope θ of the inclination after fitting the steel plates on both sides other than the weld zone respectively, according to the actual measurement data a during the above inclination 1 , b 1 , θ, by figure 2 The geometric relationship in , the real weld height b and position value a can be obtained, and all original data can be corrected accordingly.
[0075] .
[0076] .
[0077] Together you can get:
[0078] ;
[0079] .
[0080] It can be seen that the corrected expression is:
[0081] ;
[0082] .
[0083] In this way, the true weld height b and position dimension a can be calculated, and the measured value of the inclination error can be corrected.
[0084] The tilt correction adopts the method of correcting the contours of each frame one by one, which is the most important correction. In addition, the accidental jitter of the operating height of the line laser will affect the height change and distortion of the measuring point in the Y-axis direction, and the change of the moving speed will cause the three-dimensional image distortion in the Z-axis direction, which also requires the height change and movement of the line laser. speed correction.
[0085] This embodiment is designed image 3 The standard correction magnetic strip shown is composed of several isosceles triangles with standard thickness arranged in a straight line, and the vertex of the latter isosceles triangle is connected with the midpoint of the base of the former isosceles triangle. The standard correction magnetic strip is fixed on the side of the welding seam on the steel plate along the Z-axis direction. During the movement of the line laser, the width of the standard correction magnetic strip in the X-axis direction is detected at the same time, and the width of the standard correction magnetic strip is determined by the width of the standard correction magnetic strip. The Z-axis position where the line laser is located, thereby determining the exact position on the Z-axis of the actual profile curve of the weld section obtained by the line laser scanning, so as to correct the difference caused by the uneven moving speed of the line laser .
[0086] In addition, since the standard correction magnetic strip has a standard thickness, the height of the standard correction magnetic strip is detected during the movement of the line laser. When the height of the standard correction magnetic strip is inconsistent with the standard thickness, it is automatically corrected to the standard thickness. Differences caused by a high degree of occasional jitter during movement are corrected.
[0087] Through the above correction process, the actual contour curve data of the real weld section and the overall three-dimensional contour image information of the weld are obtained, and the acquisition and preliminary processing of the original contour of the weld is completed.
[0088]The key to the identification of the appearance and shape of the weld and the detection of surface defects is to scientifically and accurately identify the location of the weld, that is, to determine which part is the steel plate and which part is the weld, which is the height, width, and defect of the weld. The most important basis for size, etc. However, it is not easy to achieve due to the influence of various complex factors. After repeated experimental research in this embodiment, a method of high-dimensional fitting and secondary addressing is proposed, which can accurately identify and determine the position of the weld.
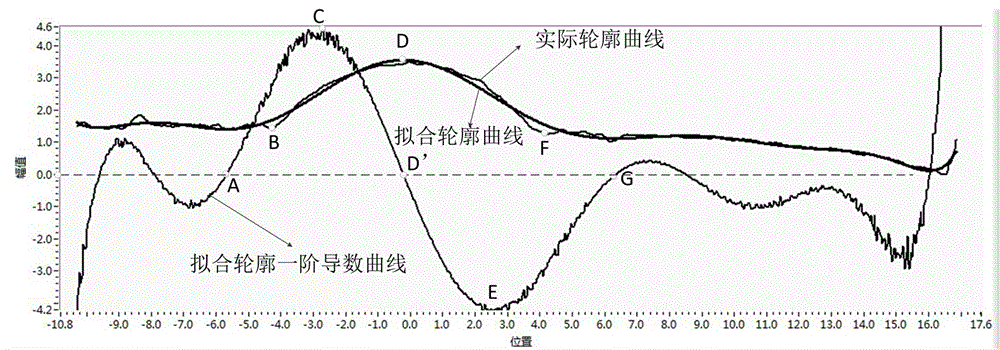
[0089] figure 1 The actual profile curve of a random section on a weld is given.
[0090] from figure 1 It can be clearly seen that there are many fluctuations in the actual contour curve of the weld seam measured, which affects the identification of the position of the weld seam. Therefore, the contour of the weld seam needs to be fitted first. In this embodiment, the least squares method is used to perform a twelfth-order high-dimensional fitting on the actual profile curve of the weld section, so as to obtain the fitted profile curve of the weld section.
[0091] The actual profile curve data of the collected weld section is composed of a series of discrete points (x i ,y i )consist of. Based on the least squares method, for a discrete sequence point p i (x i ,y i ), where i=1,2,…,m, find the approximate curve y=φ(x), and minimize the deviation between the approximate curve and the corresponding data points on the actual contour curve y=f(x), with the smallest sum of squared deviations For the fitting criterion:
[0092] .
[0093] Considering the order of the curve, the fitting curve expression is:
[0094] .
[0095] For each point on the fitted curve, there are:
[0096] .
[0097] From this, first determine the sum of the distances from each point to the fitted curve, that is, the sum of squared deviations:
[0098] .
[0099] in order to obtain a 0 to a 12 the value of , find a on the right-hand side of the above equation j Partial derivative, equal to 0 under extreme conditions, further simplification, the following matrix can be obtained:
[0100] .
[0101] Calculate the matrix coefficient a 0 to a 12 The value of , and substituted into the fitting curve expression, the fitting curve equation can be obtained. figure 1 The fitted contour curve in .
[0102] Next, take the first-order derivation of the data points on the fitted profile curve of the weld section to get figure 1 The first derivative curve of the fitted profile curve in .
[0103] exist figure 1 , first determine the maximum point D on the fitted contour curve as the center point of the weld, and its corresponding first derivative is zero. Starting from point D, find point A along the first derivative curve to the left, and point A is the Combine the point on the left side of the contour curve with the nearest first derivative of zero to point D, take point A as the starting point of the addressing range, and find the one-sided first-order derivative from the first-order derivative curve between points A and D. The maximum point C is the end point of the addressing range. Then start from the position corresponding to point A and end at the position corresponding to point C, find the point with the largest difference between the fitted contour curve and the actual contour curve within this range (the value of the fitted contour curve at this point must be greater than the actual contour curve ),which is figure 1 The point B in the weld section is the starting point of the weld on one side of the weld section in the width direction.
[0104] According to the same method, the point F on the other side of the width direction of the welding seam of this section can be found, and the point F is the end point of the welding seam on the other side in the width direction.
[0105] The distance between point B and point F is the weld width of the weld section. The vertical distance from point D to the line connecting BF is the weld height of the weld section.
[0106] Thus, a frame of the weld profile curve of the weld cross section is obtained.
[0107] Move the line laser generator along the Z-axis at a constant speed, obtain a frame of the actual contour of the weld section at an interval of 0.5mm, repeat the above-mentioned welding seam correction and identification process, and obtain the weld contour of each frame of the weld section. curve. The overall three-dimensional contour image of the weld is obtained by merging the contour curves of all the frames obtained continuously. The average weld width and height of welds in all frames are averaged to obtain the average weld width and height of the welds.
[0108] After the position of the weld and the parameters of the weld are accurately identified and determined, the weld surface can be inspected for defects.
[0109] First, the determination of a single weld profile curve is carried out. The shape of each qualified weld profile curve is relatively regular, but if there is a defect, the profile curve will be deformed. Therefore, by detecting the change trend of each data point on the weld profile curve, it is possible to identify whether the weld has defects, such as whether the weld profile has weld bead, undercut, whether the weld bead has collapsed, etc.
[0110] After a large number of tests, it is found that the appearance and shape of the welding seam are normal, and when there is no welding defect, the difference between any point on the detected welding seam contour curve and the fitting contour curve should not be greater than 0.3mm. Therefore, the present invention sets 0.3 mm as the preset standard value for determining whether the weld has defects. If the difference between any point on the weld contour curve and the fitted contour curve exceeds the preset standard value, it is determined that the point has defects.
[0111] A single weld profile curve can only reflect the existing defect on one section, but cannot reflect the overall shape of the defect and its shape along the length of the weld. Through the obtained overall three-dimensional contour image of the weld, the three-dimensional analysis of the weld defect can be carried out, and the length, width and height of the defect can be diagnosed. Along the Z-axis direction, from the first frame outline where the defect point appears to the last frame outline where the defect stops, the length of the defect can be calculated by multiplying the number of contour frames contained by the scanning step between contours by 0.5mm. At the same time, the defect points on each frame of the weld contour curve will not exist independently, but multiple points appear continuously with a certain width. Therefore, through the overall 3D contour image of the weld, the average weld defect can also be obtained. width.
[0112] If the identified weld defect is located at the edge of the weld, including the start or end point of the weld, it can be determined that the defect type of the weld is lack of fusion or undercut; and the defects located at other locations on the weld are porosity.
[0113] When identifying whether there is a weld flash defect on the weld, the present invention first sets the standard weld height of the weld, and the standard weld height is calculated according to the formula H=1+0.15b, where H is the standard weld height, mm ; b is the thickness of the steel plate, mm.
[0114] Subsequently, the welding seam is divided into a plurality of standard sections along the Z-axis direction, each standard section has a length of 2 mm, and the segmented average welding seam height of each standard section is calculated according to the calculation method of the average welding seam height. The average weld height of each segment is compared with the standard weld height. When the difference between the two is greater than the preset standard value of 0.3mm, it is determined that there is a weld flash in the standard segment, and the position of the standard segment is the weld flash position and the height. The difference is the size of the weld bead.
[0115] Through the above detection process in this embodiment, the actual location of the weld, as well as the width, height and shape information of the weld can be accurately determined, and then the types, positions and sizes of various defects existing on the weld can be accurately determined. At the same time, through the welding seam data obtained in this embodiment, the change curve of key welding seam information such as the width and height of the welding seam with the scanning process can also be displayed in real time.

PUM

no PUM

Description & Claims & Application Information

We can also present the details of the Description, Claims and Application information to help users get a comprehensive understanding of the technical details of the patent, such as background art, summary of invention, brief description of drawings, description of embodiments, and other original content. On the other hand, users can also determine the specific scope of protection of the technology through the list of claims; as well as understand the changes in the life cycle of the technology with the presentation of the patent timeline. Login to view more.

Similar technology patents

Classification and recommendation of technical efficacy words

  • Accurate detection
  • Improve detection efficiency

Deep-convolution-neural-network-based CT pulmonary nodule detection method

ActiveCN107016665AEfficient and accurate detectionAccurate detectionImage enhancementImage analysisPositive probabilityResidual neural network
Owner:ZHEJIANG UNIV

Materials real-time detection and foreign body eliminating system based on machine vision

InactiveCN101176872AImprove detection efficiencyImprove image quality and accuracy of material detection and foreign object recognitionCharacter and pattern recognitionSortingLight sourceImage identification
Owner:SOUTH CHINA UNIV OF TECH

People also interested in

Why Eureka
Try Eureka