Processing method of point spread function
A point spread function and processing method technology, applied in the field of point spread function processing, can solve the problem of low resolution of microscope images, achieve wide application prospects, simplify hardware design and implementation, and improve the effect of signal reconstruction
- Summary
- Abstract
- Description
- Claims
- Application Information
AI Technical Summary
Problems solved by technology
Method used
Image

Examples
specific Embodiment approach 1
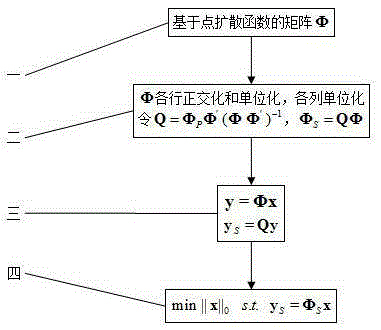
[0017] Specific implementation mode one: according to the instructions attached figure 1 This embodiment will be specifically described. A processing method of a point spread function, the process of the method is:
[0018] Step 1: Based on the experiment, the point spread function of the microscope is fitted by a Gaussian function or a Bessel function, and the low-resolution image y recorded by the image recording camera of the microscope is divided into high-resolution grids with smaller pixels;
[0019] Step 2: Take the center of each grid as the source point of the point spread function, record the value of the point spread function on each pixel of the low-resolution image, and then connect the rows or columns of the values on each pixel end to end to form a point-based column vector Φ of the spread function j ;
[0020] Step 3: The column vector Φ of the point spread function of all points in the grid based on the high-resolution grid j The matrix Φ based on the po...
specific Embodiment approach 2
[0027] Embodiment 2: This embodiment is a further description of the processing method of a point spread function described in Embodiment 1. In step 1, the large low-resolution image y can be recorded by an existing microscope with any resolution. An image of any resolution captured by the camera, y∈R M , x∈R N .
specific Embodiment approach 3
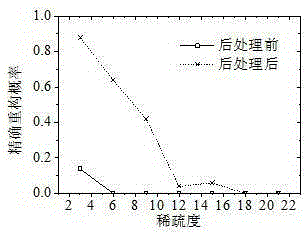
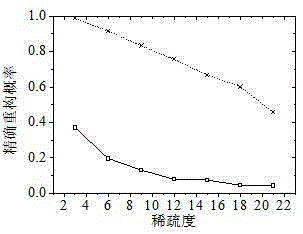
[0028] Specific implementation mode three: the following combination figure 2 — Figure 4 This embodiment will be specifically described. In this embodiment, Gaussian signals with different degrees of sparsity are used to correspond to the matrix Φ before and after processing. 169×4096 , the matrix size is 169×4096, compare the reconstruction probability of the reconstruction SBR greater than 90dB after each 500 experiments. figure 2 middle belt Marked is the curve before treatment; with Marked are post-treatment curves. figure 2 Indicates the calculation result of the OMP reconstruction algorithm; image 3 Indicates the calculation result of the BP reconstruction algorithm; Figure 4 Indicates the calculation result of the CVX reconstruction algorithm.
[0029] Experimental results such as Figure 2-Figure 4 shown. Depend on figure 2 It can be seen that based on the OMP reconstruction algorithm, the post-processing reconstruction effect curve is located above ...
PUM
 Abstract
Description
Claims
Application Information