Hierarchical clustering-based system steady state detection algorithm

A technology of hierarchical clustering and detection algorithm, applied in computing, computer parts, instruments, etc., can solve the problems of poor universality, strong dependence on process objects, weak applicability, etc., to achieve strong applicability and avoid the amount of calculation. dramatic effect

Active Publication Date: 2016-07-27
ZHEJIANG UNIV
View PDF3 Cites 5 Cited by
  • Summary
  • Abstract
  • Description
  • Claims
  • Application Information

AI Technical Summary

Problems solved by technology

[0012] Therefore, the main disadvantage of the traditional method is the strong dependence on the process object, poor universality, and mainly for single-variable steady-s

Method used


Image

  • Hierarchical clustering-based system steady state detection algorithm
  • Hierarchical clustering-based system steady state detection algorithm
  • Hierarchical clustering-based system steady state detection algorithm

Examples


Embodiment 1

[0067] Embodiment 1 is aimed at a second-order single-input single-output system, and the input and output after simulation processing by the method of the present invention are as follows: Figure 4 As shown, the simulation time length is 100s, the sampling interval is 0.1s, Figure 4 (a) represents the input variable curve, Figure 4 (b) shows the output variable curve.

[0068] Noise is not added in the variable of embodiment 1, which can be obtained from Figure 4 It can be seen from the curve that the system is in a steady state at the initial stage (t=0~300), and at t=300 the input generates a ramp adjustment, and the system enters a transitional state. When the ramp signal ends after t=600, the output also tends to Stabilization The final system enters another steady state. Since no noise is added, the degree of aggregation of the system state is very high in the steady state. Here, instead of using the threshold selection method of the above algorithm, a small thres...

Embodiment 2

[0073] Embodiment 2 adds noise for simulation, and further explains the threshold selection process based on the single-input-single-out system process used in Embodiment 1. The input and output of the simulation system with noise added is as follows Figure 7 as shown, Figure 7 (a) represents the input variable curve, Figure 7 (b) represents the output variable curve:

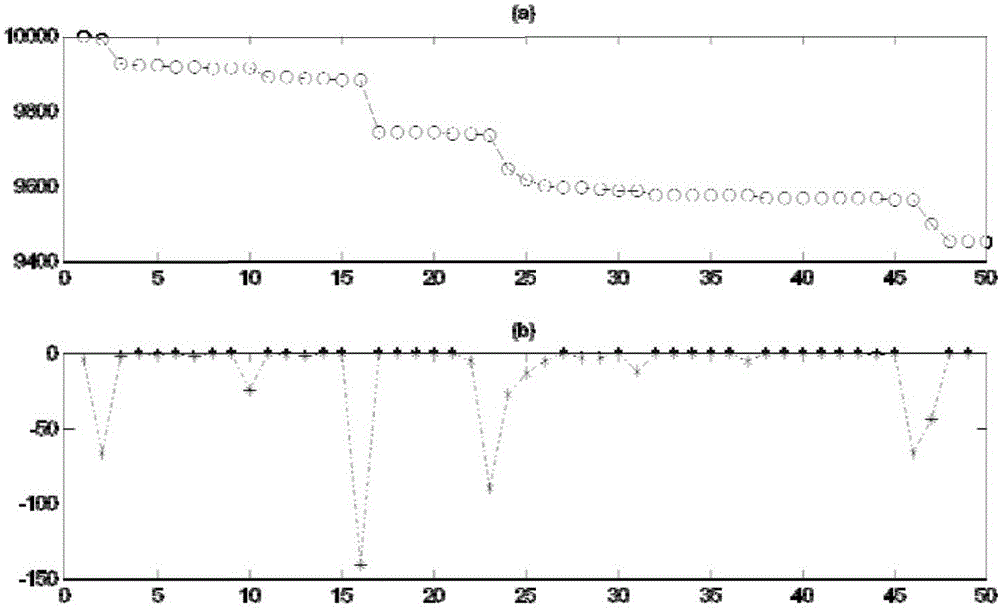
[0074] Figure 7 It can be seen from the figure that the system is in a steady state within the interval of time t=0~300, and then the input u produces a ramp change, and after a period of transition state, the system enters another steady state. In the state space of the whole process, the state points of the two steady states are highly aggregated, while the transition state points are scattered. The selection of the threshold is enumerated from large to small. As the clustering threshold shrinks, the degree of concentration within each class becomes higher and higher. When the jth step is reached, if ...

Embodiment 3

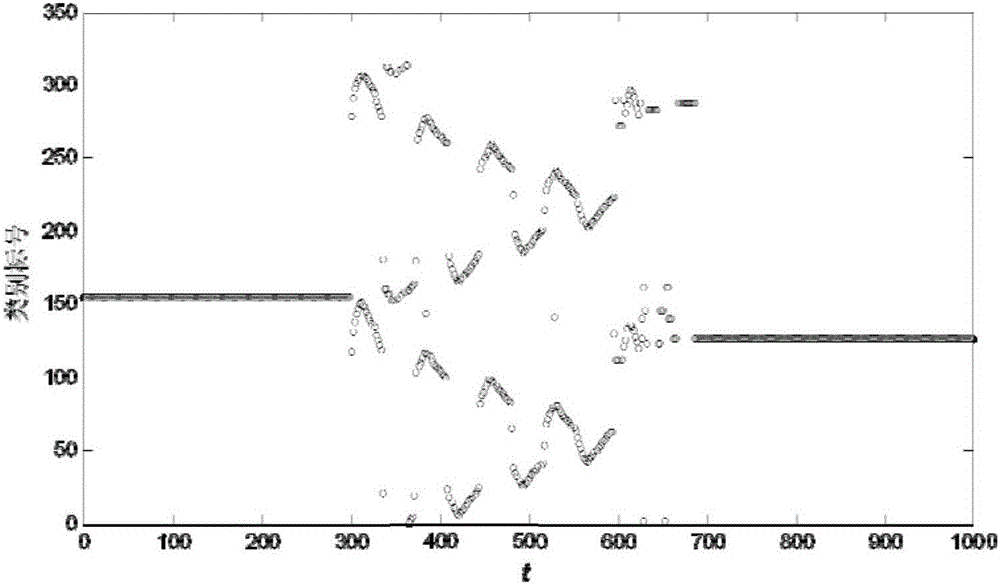
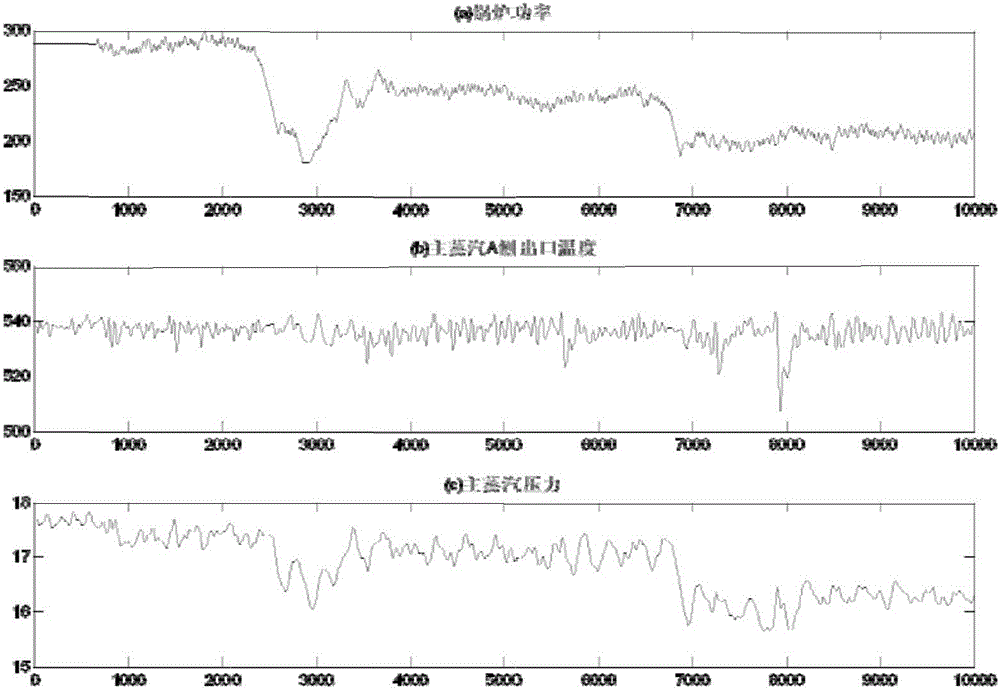
[0078] Embodiment 3 is applied to the historical data generated in the actual process, and the boiler data of a 60MW unit of a certain power plant is used for data experimentation. The data mainly includes: boiler load command, power generation, coal intake, air intake, steam water temperature and pressure at each measurement point, etc., a total of 180 dimensions. Select 10,000 points of data and use the above clustering algorithm for steady-state detection. Changes in the main variables during this period are as follows: Figure 9 Shown:

[0079] From Figure 9 It can be seen from the figure that in the time period studied, there were two major adjustments in the system load, and roughly three periods of steady-state data were generated within the interval. Both the main steam temperature and the main steam pressure fluctuate greatly, and the fluctuation of the system cannot even be seen from the steam temperature curve. Next, the state points composed of all the variabl...


PUM


Abstract

The invention discloses a hierarchical clustering-based system steady state detection algorithm. The algorithm comprises the following steps: for industrial data in a period of continuous time interval, calculating distances between every two types of data to obtain a matrix, finding the minimum distance values in the matrix, combining the minimum distance values into a new type, deleting the new type, carrying out processing to obtain an updated matrix and carrying out iterative computation to obtain an expression matrix of a hierarchical clustering tree; for the expression matrix, carrying out computation from the last iterative numerical value to the first iterative numerical value in sequence so as to obtain clustering result reasonability values of the computations, carrying out solving and computation on the computed clustering result reasonability values to obtain final threshold values, carrying out clustering computation on the industrial data through the final threshold values so as to obtain a final clustering result sequence, and carrying out joint time sequence judgement to obtain system steady state condition. The algorithm disclosed in the invention is strong in applicability and has the effect of avoiding the sharp calculation amount increase phenomenon caused by data dimensionality during the data processing.

Description

technical field [0001] The invention relates to a system detection method, in particular to a system steady-state detection algorithm based on hierarchical clustering. Background technique [0002] Steady state is the most important and common assumption in the study of a process system. Whether the system is in a steady state is directly related to the subsequent modeling, control and optimization methods of the system. The internal principle and structure of the process system are complicated, which is manifested by the strong coupling of physical quantities and the strong nonlinearity of the system. When the system is in an unstable state, the data characteristics of each variable of the system change drastically, and the numerical value is unstable or abnormal, and there is a large deviation from the input-output relationship of the real system. Only when the system is in a stable working condition can each parameter and variable have a strong state consistency. Based...

Claims


Application Information

Patent Timeline
IPC IPC(8): G06K9/62
CPCG06F18/232G06F18/22
Inventor 赵均季一丁邵之江徐祖华
Owner ZHEJIANG UNIV
Why Eureka
Try Eureka