
Method for building relation model between turbidity and single sand

A relational model and turbidity technology, applied in special data processing applications, instruments, electrical digital data processing, etc., can solve problems such as risk, heavy, and sediment monitoring that cannot adapt to the development of hydrological information, so as to improve work efficiency and improve The effect of monitoring accuracy

Inactive Publication Date: 2016-08-03
NANNING HYDROLOGY & WATER RESOURCE BUREAU
View PDF3 Cites 9 Cited by
  • Summary
  • Abstract
  • Description
  • Claims
  • Application Information

AI Technical Summary

Problems solved by technology

[0003] At present, the relationship between water turbidity and sand content is manually tested. After taking water samples, filtering, drying, and weighing four steps, there are problems of risk, heavy, time-consuming, and labor-intensive, especially when taking water. To take water samples, a survey boat should be used to take water samples from the mainstream of the river, taking water samples at the risk of fast currents and floating objects, and it is more difficult to take water samples at night
The shortcomings of these technologies make sediment monitoring unable to adapt to the development of hydrological information, restricting the ability of hydrological information services

Method used


Image

  • Method for building relation model between turbidity and single sand
  • Method for building relation model between turbidity and single sand
  • Method for building relation model between turbidity and single sand

Examples


Embodiment Construction

[0022] The technical solution of the present invention will be described in further non-limiting detail below in combination with preferred embodiments and accompanying drawings.

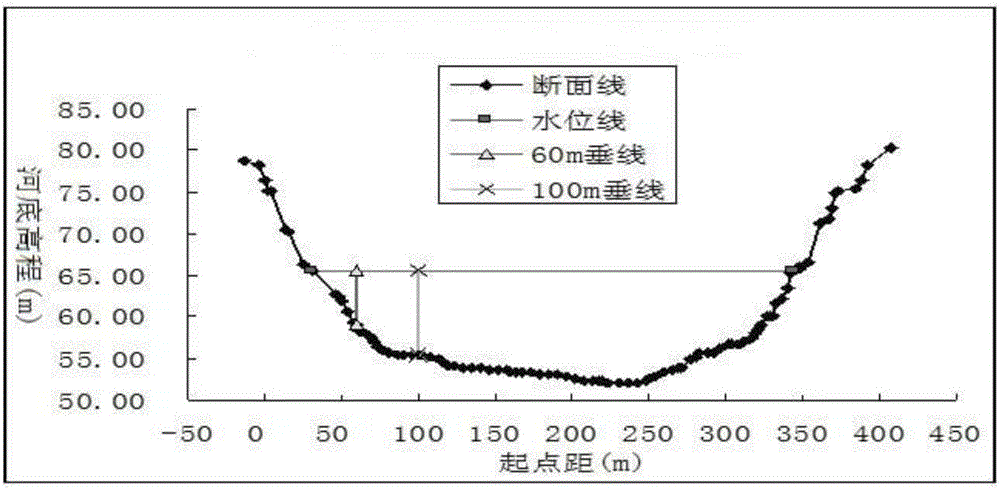
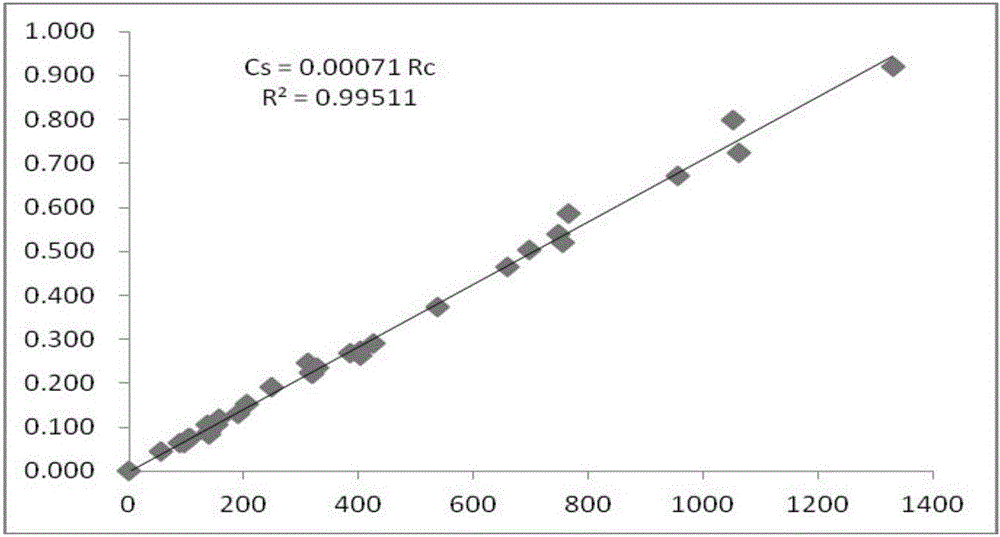
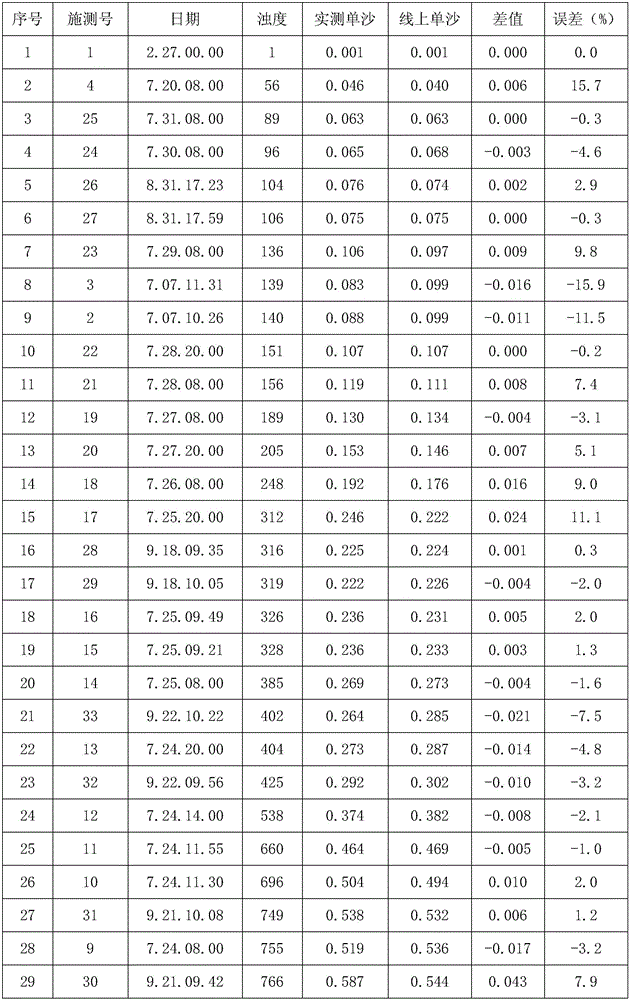
[0023] At the Nanning Hydrological Station, a multi-parameter water quality turbidimeter produced by the American Hach Company was used to fix the measuring boat on the vertical line 60m away from the starting point. figure 1 shown. The probe of the water quality turbidimeter is fixed at a water depth of 0.5m for turbidity and manual testing of single sand, and the online turbidity takes the average of turbidity data for 5 to 35 minutes, and compares 33 times to obtain figure 2 The 60m vertical line turbidity and single sand relationship diagram shown, after calibration, the relationship model between turbidity and single sand is C S =0.00071R C , correlation coefficient r=0.9976, systematic deviation 0.4%, standard deviation 6.40%, qualified rate 100%. The above conclusions were tested and calc...


PUM


Abstract

The invention discloses a method for building a relation model between turbidity and single sand. The method adopts a water turbidity meter, and comprises the following steps: step 1, selecting a site as a monitoring point according to the following requirements: 1) the reach of the site is straight and has no branch flow, flow cannot ice, and silt in the flow is only suspended sediment; 2) a monitoring section is U-shaped or V-shaped; 3) a water level approaches to the historical lowest level; 4) the monitoring point is 5 to 10 meters away from water; step 2, carrying out comparing measurement, that is, on an original measurement single sand section, averaging single sand with a vertical line of mixture of a water sample being 0.2 in position relative to an original measurement single sand vertical line and another water sample being 0.8 in position relative to the original measurement single sand vertical line, wherein the water turbidity meter is arranged on a selected vertical line fixing point, a probe of the water turbidity meter is fixed on a point being 0.5m underwater for comparing measurement, and comparing measurement is carried out for 31 times or more; step 3, building the relation model between turbidity and single sand, wherein the relational expression is CS equal to KRC. The built relation model can be used for monitoring suspended load index sediment concentration automatically, the monitoring precision and the efficiency are high, and the technical problem of slow and less hydrological information sources is solved.

Description

technical field [0001] The invention relates to the field of hydrological monitoring, and in particular designs a method for establishing a relationship model between turbidity and single sand. Background technique [0002] The turbidity of water is caused by fine suspended particles, which is related to the mass concentration of suspended solids, particle size, shape, and refractive index. In natural river water bodies, the turbidity is related to the sediment content of the water body. If the turbidity is small, the sediment content will be small; if the turbidity is high, the sediment content will be large. It can be seen that the turbidity of water has a close positive correlation with the sediment concentration. [0003] At present, the relationship between water turbidity and sand content is manually tested. After taking water samples, filtering, drying, and weighing four steps, there are problems of risk, heavy, time-consuming, and labor-intensive, especially when ta...

Claims


Application Information

Patent Timeline
Patent Type & Authority Applications(China)
IPC IPC(8): G06F19/00
CPCG16Z99/00
Inventor 韦广龙梁朝玉
Owner NANNING HYDROLOGY & WATER RESOURCE BUREAU
Learn More