Quantitative analysis method for ion mobility spectrum

A technology of ion mobility spectrometry and quantitative analysis, applied in the field of accurate quantitative analysis, to achieve the effect of simple measurement method, easy correction, and improved detection sensitivity

Active Publication Date: 2016-12-07
DALIAN INST OF CHEM PHYSICS CHINESE ACAD OF SCI
View PDF5 Cites 12 Cited by
  • Summary
  • Abstract
  • Description
  • Claims
  • Application Information

AI Technical Summary

Problems solved by technology

However, the quantitative analysis of ion mobility spectrometry has not ...

Method used


Image

  • Quantitative analysis method for ion mobility spectrum
  • Quantitative analysis method for ion mobility spectrum
  • Quantitative analysis method for ion mobility spectrum

Examples


Embodiment 1

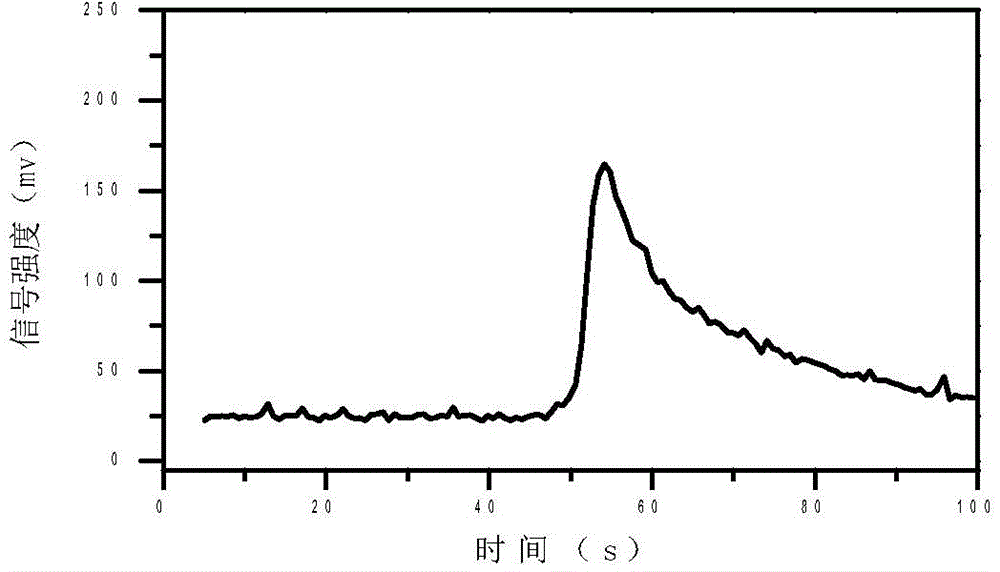
[0030] Configuration propofol content is the blood sample of 5ppm, carry out ion mobility spectrometry determination according to above-mentioned conditions, such as figure 1 It is the tracking trend line of the thermal analysis signal of propofol in 5ppm blood. The tracking trend line takes the time unit second as the abscissa. After the data is averaged 20 times, the whole process from the beginning of the thermal analysis of the sample to the maximum signal and the end of the signal acquisition is continuously recorded. Each concentration was repeated three times, and the average value of the three data was used to fit the standard curve equation.

[0031] In the range of 40-100S, the sum of all data points after deducting the baseline 26mv is the thermal analysis area of ​​propofol in 5ppm (ug / ml) blood.

Embodiment 2

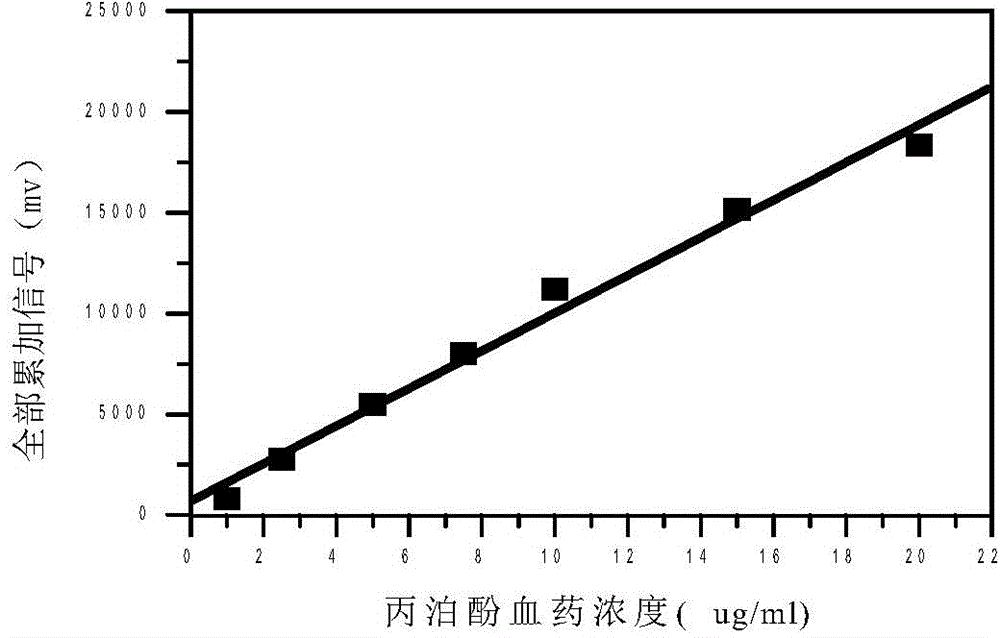
[0033] Take the 0.5, 1, 2.5, 5, 7.5, 10, 15, 20ug / ml blood propofol samples prepared above, keep the transfer tube temperature at 100°C, injector temperature at 80°C, carrier gas (purified air ), drift gas (purified air) air flow is 400mL / min, 600mL / min respectively. Record the average value of data repeated three times to track the trend line. The background signal is basically 25-30mv, so the background signal is deducted within this range. The linear relationship between concentration and thermal analysis area fitting is the generated standard curve equation. The equation of the standard curve generated by fitting is Y=671.48+934.42·X, and the correlation coefficient R=0.9928.

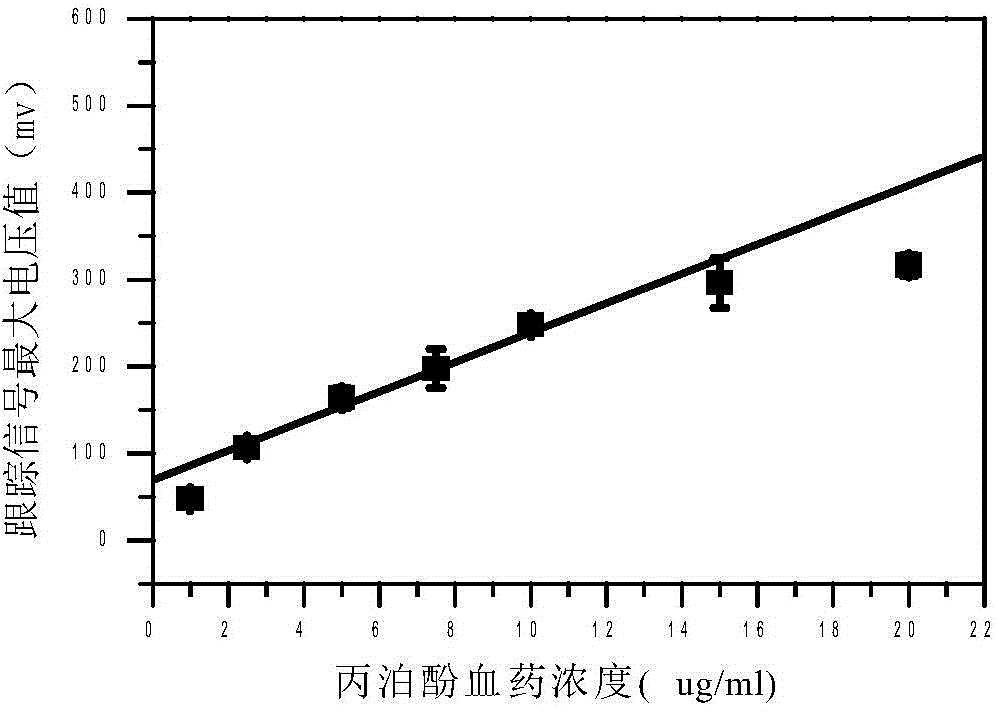
[0034] In the same embodiment 2, the data adopts the numerical analysis standard curve of the maximum signal height of the tracking trend line (such as image 3 ), the equation of the standard curve generated by fitting between the highest intensity voltage value of the analytical signal peak and ...

Embodiment 3

[0038]A blood sample with a propofol concentration of 5ug / ml was prepared, and the blood was blank plasma provided by the hospital. During the experiment, the temperature of the transfer tube was kept at 100°C, the temperature of the injector was 80°C, and the flow rates of carrier gas (purified air) and drift gas (purified air) were 400mL / min and 600mL / min, respectively. The software data is averaged 20 times. Samples of each concentration were repeated 3 times in parallel to get the average value, and substituted into the standard curve equation Y=671.48+934.42 X fitted by the blood drug concentration and analytical area to obtain the relative deviation of the propofol concentration within 10%, which satisfied the analysis and detection Require. At the same time, the detection sensitivity is also improved by an order of magnitude.


PUM


Abstract

The present invention discloses an accurate quantitative analysis method for an ion mobility spectrum rapid detection sample. According to the method, based on the migration time obtained through qualitative analysis of an ion mobility spectrum, the thermal analysis process of the whole sample to be detected is completely recorded, and the recorded curve is defined as the tracking trend line of the thermal analysis of the sample; the samples with different concentrations are prepared by adopting the ion mobility spectrum technology as the base detection technology, and the tracking trend of the sample is subjected to data analysis; and by adopting the propofol in blood as an example, a standard curve equation y=671.48+934.42.x of the ion mobility spectrum detection is established between the plasma concentration of 1-20 ppm, wherein the correlation coefficient r is 0.9928. According to the present invention, the method is simple, rapid and efficient, and can be widely used for the quantitative analysis of the ion mobility spectrum rapid detection sample.

Description

technical field [0001] The invention relates to an accurate quantitative analysis method for quickly detecting samples by ion mobility spectrometry. Based on the qualitative analysis of migration time by ion mobility spectrometry, the method records all the thermal analysis process of the sample to be tested, and the recorded curve is the tracking trend line of thermal analysis. Using ion mobility spectrometry as the basic detection technology, samples with different concentrations are prepared, and data analysis is performed on the tracking trend line of the samples. The method is simple, rapid and efficient, and can be widely used in the quantitative analysis of fast detection samples by ion mobility spectrometry. Background technique [0002] Ion Mobility Spectrometry (IMS) technology is a rapid separation and detection technology that appeared in the 1970s. Compared with traditional mass spectrometry and chromatography instruments, it has the characteristics of simple s...

Claims


Application Information

Patent Timeline
IPC IPC(8): G01N27/62
Inventor 王新李海洋鞠帮玉周庆华
Owner DALIAN INST OF CHEM PHYSICS CHINESE ACAD OF SCI
Why Eureka
Try Eureka