Approximately optimal radar target detection method against K-distributed clutter plus noise
A radar target and detection method technology, which is applied to radio wave measurement systems, instruments, etc., can solve problems such as poor detection performance, complex detector expressions, and reduced detection performance, and achieve the effect of improving detection performance
- Summary
- Abstract
- Description
- Claims
- Application Information
AI Technical Summary
Problems solved by technology
Method used
Image

Examples
Embodiment Construction
[0024] The present invention will be further described below in conjunction with accompanying drawing:
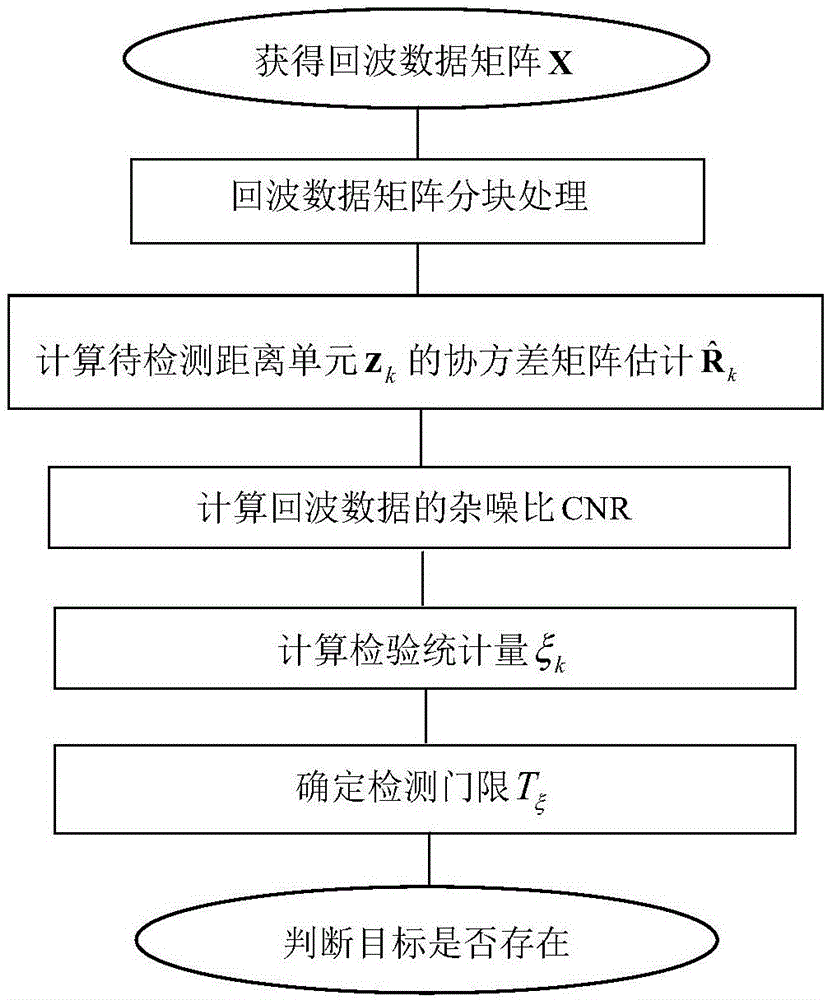
[0025] refer to figure 1 , the implementation steps of the present invention are as follows:
[0026] Step 1, obtain the echo data matrix X.
[0027] The radar transmitter transmits a continuous pulse signal, and the pulse signal is irradiated on the surface of the object to generate an echo. The radar receiver receives the echo data matrix X, and the echo data matrix X is a matrix with a size of Q×M dimensions, where Q represents the echo Accumulated pulse number of data, M indicates the number of distance units of echo data.
[0028] Step 2, processing the echo data matrix in blocks.
[0029] The echo data matrix X is equally divided into B echo data blocks of N×M dimension along the pulse dimension, where N represents the pulse number of each echo data block, and the B echo data blocks are respectively denoted as X 1 ,X 2 ...,X b ,...,X B , X b Indicates the bth ...
PUM
 Abstract
Description
Claims
Application Information