Eureka AIR delivers breakthrough ideas for toughest innovation challenges, trusted by R&D personnel around the world.

Acquisition methods of linear density coefficient curve and standard tuft curve

An acquisition method and technology of density coefficient, applied in the field of acquisition of line density coefficient curve, can solve problems such as influence of calculation accuracy, inapplicability, random fluctuation of line density or maximum line density measurement, etc., to overcome calculation deviation and eliminate position deviation. Effect

Active Publication Date: 2017-05-31
DONGHUA UNIV
View PDF10 Cites 4 Cited by
  • Summary
  • Abstract
  • Description
  • Claims
  • Application Information

AI Technical Summary

Problems solved by technology

[0008] However, the early calculation method of whisker density curve (Wang Fumei, Wu Hongyan. Method for obtaining whisker curve ZL2012 1 010328089.5) was calculated by Lambert-Beer optical theory and then corrected according to the experimental results of cotton fiber. Other fibers present obvious inapplicability
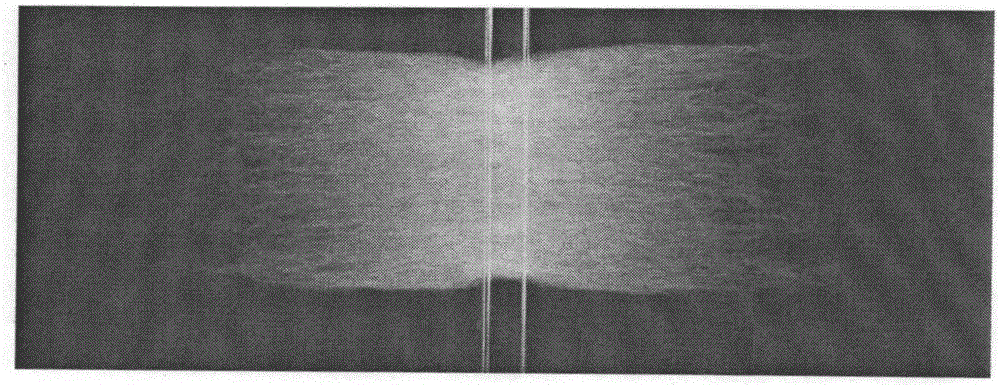
In addition, in the application, it was found that the following incomplete problems still existed in the early inventions: (1) lack of an accurate determination method for the starting line position of the whiskers
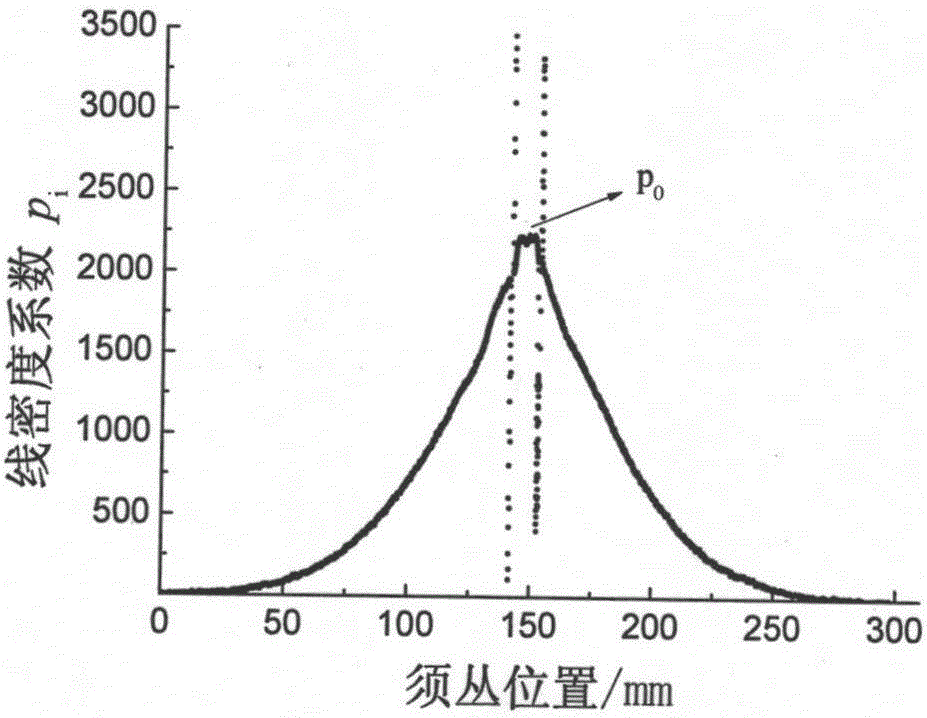
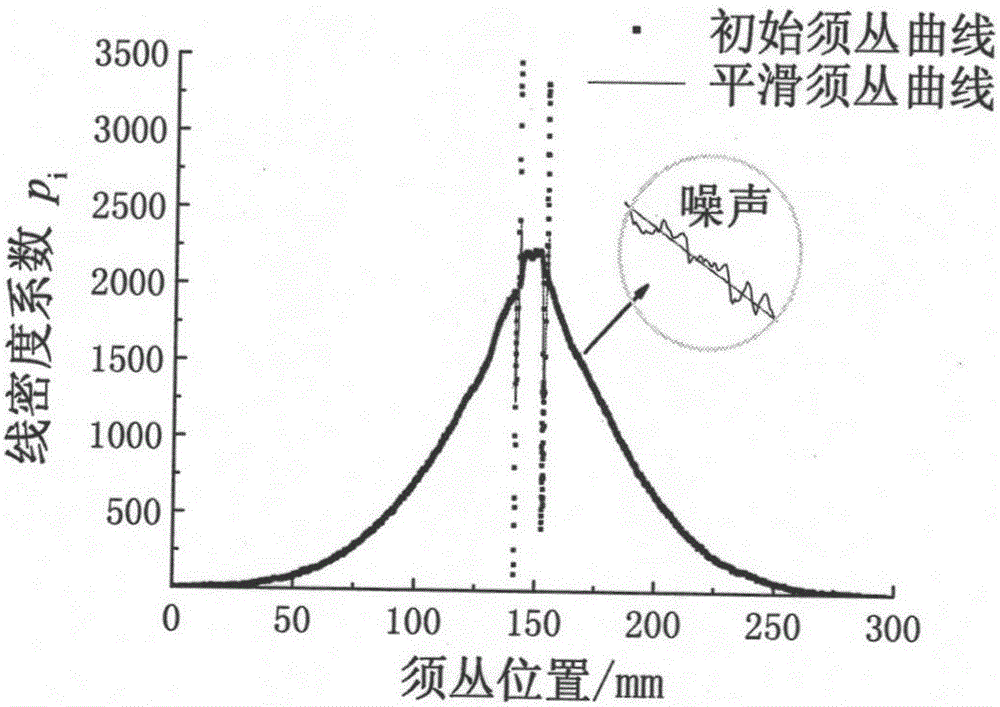
(2) There are random fluctuations in the measurement of the linear density at the starting position of the whiskers or the maximum linear density required when calculating the relative linear density curve of the whiskers, which has a significant impact on the calculation accuracy
(3) Lack of curl correction factor for wool tufts

Method used


Image

  • Acquisition methods of linear density coefficient curve and standard tuft curve
  • Acquisition methods of linear density coefficient curve and standard tuft curve
  • Acquisition methods of linear density coefficient curve and standard tuft curve

Examples


Embodiment 1

[0093] Utilize the inventive method to make 2 double-ended random whiskers of 1# tops, the clamp width is 10mm, measure the light-transmitting image of each whiskers, the incident spectrum intensity is evenly distributed in the visible light range, after testing at the average wavelength of the incident light Lower Wool Fiber R ∞ = 0.853. Then, using the method of the present invention to calculate the whisker curves of these two double-ended random whiskers, a=0.96, b=1.05. On the other hand, the length distribution of the wool top was measured by the Almeter instrument of the international standard method, and the whisker curve was converted from the Almeter data by using the 2-time integral theoretical relationship deduced by Wu Hongyan. Comparison of two whisker cluster curves Figure 5 As shown, the random whisker image method among the figures represents the method of the present invention, obviously the whisker curve obtained based on the method of the present inventi...

Embodiment 2

[0095] Utilize the inventive method to make double-ended random whiskers of 2#~7# wool tops, the clamp width is 15mm, each kind of wool top makes 2 double-ended random whiskers, measures the light-transmitting image of each whiskers, and the incident light curve With embodiment 1. Then, utilize the method of the present invention to calculate the whisker curve of each sample, R ∞ , a and b are with embodiment 1. On the other hand, the length distribution of tops 2# to 7# was tested by the Almeter instrument of the international standard method, and the whisker curves of each top were converted from the Almeter data by the method described in Example 1. Comparison of two kinds of whisker curves of the same wool top Figure 6 ~ Figure 11 Shown, among the figure random whisker image method represents the method of the present invention. Figure 6 ~ Figure 11 All show that the whisker cluster curve obtained based on the method of the present invention is highly consistent with ...


PUM


Abstract

According to the technical schemes, the invention provides an acquisition method of a linear density coefficient curve, a positioning method of a double-end tuft center line and an acquisition method of a standard tuft curve. The methods have the advantages that a calculation deviation of a Lambert-Beer optical algorithm is eliminated, and the problem that in existing optical measurement, the deviation of the position where the fiber density is higher is larger is solved; by means of the novel sampling, image measurement and signal analysis method, the problems that noise is generated in measurement signals, and a tuft start line is difficult to recognize can be avoided, the accurate position of the tuft start line and accurate information of the highest linear density are obtained, and the complete and accurate tuft curve and linear density curve are calculated.

Description

technical field [0001] The invention relates to a method for obtaining a linear density coefficient curve and a method for obtaining a standard whisker curve based on the method for obtaining the linear density coefficient curve. Background technique [0002] A large-capacity measuring instrument for fiber length usually uses a photoelectric or capacitive sensor to measure the linear density curve of the whiskers, that is, the relationship curve between the cross-sectional position of the whiskers and the amount of fibers, referred to as the whiskers curve; then, according to the fiber length distribution and The mathematical relationship between the whisker-plexus curves calculates the length distribution curves and characteristic indices of the fibers. Therefore, accurate measurement of the linear density curve of whiskers is the basis and premise of accurate analysis of the length-frequency distribution curve and characteristic indicators. [0003] When measuring the mas...

Claims


Application Information

Patent Timeline
IPC IPC(8): G01N9/24
CPCG01N9/24
Inventor 王府梅陈丽君吴美琴赵林
Owner DONGHUA UNIV
Why Eureka
Eureka Blog
Learn More