Pure spectrum extraction from biological samples

A purely spectroscopic, sample-based technique used in the imaging of biological samples to address issues such as increased complexity

Active Publication Date: 2017-05-31
AKOYA BIOSCI INC
View PDF9 Cites 3 Cited by
  • Summary
  • Abstract
  • Description
  • Claims
  • Application Information

AI Technical Summary

Problems solved by technology
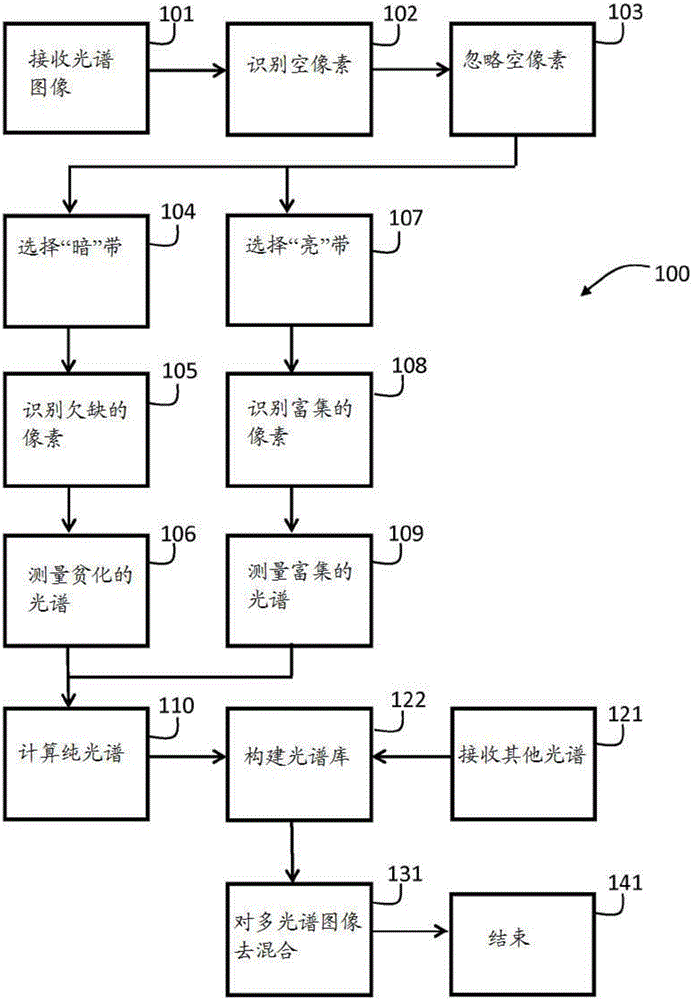
This further adds to the complexity of the above determination

Method used


Image

  • Pure spectrum extraction from biological samples
  • Pure spectrum extraction from biological samples
  • Pure spectrum extraction from biological samples

Examples


example 1

[0160] In this example, the specimen is a breast cancer specimen obtained as a formalin-fixed, paraffin-enclosed (FFPE) tissue block from which 4-micron sections were dissected using a microtome and subsequently subjected to standard histological procedures. processed for deparaffinization, antigen retrieval, and used in conjunction with The PR probe of 594 dye (available from Life Science Solutions, Caliper, Calif.) was immunofluorescent (IF) labeled. They were counterstained with DAPI and then coverslipped on standard microscope slides. It was imaged using the same tools, ext-filters and wavelengths as previously discussed.

[0161] In this example, the goal is to determine Pure dye spectrum of 594, so dark bands include all image cube planes acquired with DAPI or FITC external filters, and bright bands include all image cube planes acquired with Texas Red filter. A color image is generated from the image cube; the blue, green, and red image planes are shown as Figure...

example 2

[0166] The same procedure as in Example 1 was followed on another sample from the same tissue block on which no DAPI counterstain was applied. Figure 11A The averaged dye-rich, dye-deficient and pure dye spectra obtained are shown as curves 161, 162 and 163, respectively. The dark band was then set to zero and the resulting spectrum was normalized; the result is shown as curve 164 .

[0167] use to measure based on this sample for Spectra of 594 dyes, utilizing the same autofluorescence blank as in the previous example. The same operator performs the same steps as previously described; pure spectra obtained for the dye-loaded, autofluorescent in Figure 11B are shown as curves 165, 166 and 167, respectively.

[0168] Comparing curves 154 and 164, there is no major difference between them, indicating that despite the presence of nuclear-localized (PR antibodies and thus Strong, promiscuous DAPI signal in the same cell compartment in which 594 is mainly located), still ...

example 3

[0171] In a further example, the sample is a breast cancer sample obtained as a formalin-fixed, paraffin-enclosed (FFPE) tissue block from which 4 micron sections were cut using a microtome and subsequently subjected to standard tissue Chemical treatment for dewaxing and antigen retrieval. However, immunofluorescence (IF) calibration was not performed. They were counterstained with DAPI and then coverslipped on standard microscope slides. It was imaged using the same tools, ext-filters and wavelengths as previously discussed.

[0172] Pure DAPI spectra were determined according to the method disclosed herein, using all image cube layers for which FITC external filters were utilized as dark bands. Bright bands include all image cube layers for which the DAPI extrinsic filter was utilized. Image cube layers acquired with the Texas Red extrinsic filter are not assigned to dark or light bands. Dye-rich and dye-deficient pixels were selected using the same procedure and thresho...


PUM


Abstract

The disclosure features methods that include obtaining multispectral image information for a sample that includes a fluorescent dye, calculating from an image cube of the information a first spectrum and a second spectrum, and calculating a pure spectrum of the fluorescent dye in the sample based on the first and second spectra, where a relative contribution of light emission from the fluorescent dye to the second spectrum is larger than a relative contribution of light emission from the fluorescent dye to the first spectrum, where calculating the first and second spectra includes identifying corresponding first and second sets of pixel intensity values in the image cube, and where identifying the first set of pixel intensity values includes designating one or more layers of the image cube as a first layer set.

Description

[0001] Cross References to Related Applications [0002] This application claims priority to US Provisional Patent Application No. 62 / 022,635, filed July 9, 2014, the entire contents of which are incorporated herein by reference. technical field [0003] The present disclosure relates to imaging of biological samples, including systems and methods for determining pure spectra useful in the analysis of fluorescent multiband or multispectral images. Background technique [0004] Fluorescent imaging of biological cells and tissue samples is used to visualize the presence and expression levels of specific antigens using probes that bind antibodies to fluorescent dyes. It is possible to visualize multiple proteins in a given section of a tissue section using probes targeted to specific antigens of interest, together with one or more tissue dyes such as DAPI, nuclear counterstains. Other targets such as RNA or DNA can be visualized using fluorescence in situ hybridization and oli...

Claims


Application Information

Patent Timeline
Patent Type & Authority Applications(China)
IPC IPC(8): G01J3/28G01J3/44G01N21/64
Inventor P.J.米勒K.S.约翰逊
Owner AKOYA BIOSCI INC
Why Eureka
Try Eureka