

Principal component analysis-based key encephalic region measurement method
A technology of principal component analysis and measurement method, applied in the field of neuroimaging data analysis, which can solve the problems of inconsistency and failure to consider the proportion of nodes
- Summary
- Abstract
- Description
- Claims
- Application Information
AI Technical Summary
Problems solved by technology
Method used
Image

Examples
Embodiment 2
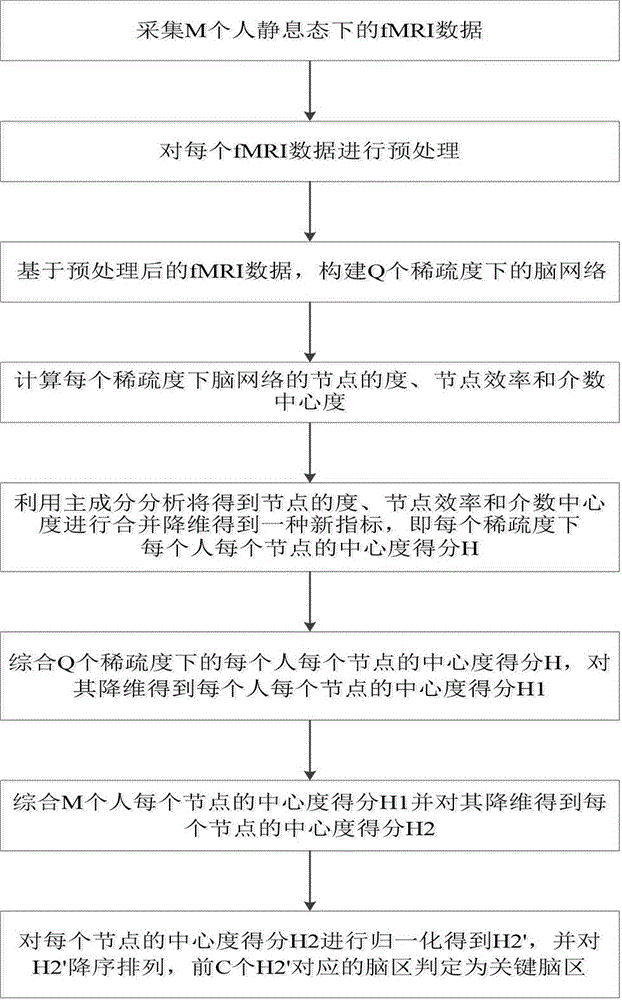
[0206] Embodiment two: a kind of measurement method of key brain region based on principal component analysis of the present invention, comprises the following steps:
[0207] Step 1: Collect fMRI data of M patients with functional diarrhea in a resting state;
[0208] Step 2: Preprocess each fMRI data; the specific operation is as follows:
[0209] Step 2.1: remove the first 10 time points from the collected fMRI data;
[0210] Step 2.2: Perform time layer correction on the fMRI data after removing the time points;
[0211] Step 2.3: Perform head movement correction on the time layer corrected fMRI data;
[0212] Step 2.4: Spatial normalization of the head movement corrected fMRI data;
[0213] Step 2.5: de-linearize the spatially normalized fMRI data;
[0214] Step 2.6: band-pass filter the fMRI data after de-linear drift, the frequency range of the band-pass filter is 0.01-0.08 Hz;
[0215] Step 3: Based on the preprocessed fMRI data, construct a brain network under Q ...
Embodiment 3
[0311] Embodiment three: this embodiment selects a group of healthy people as subjects, the number is 20, as a healthy control group of patients with functional diarrhea, and obtains the measurement results of the criticality of brain regions; the present invention in embodiment three In this method, only a group of subjects was exchanged, and the operation steps were exactly the same as those in Example 2, which will not be repeated here; the centrality scores of the 90 brain regions finally obtained are shown in Table 2.
[0312] Table 2 Centrality scores of 90 brain regions of healthy control population obtained by different measurement methods
[0313]
[0314]
[0315] Table 3 The top 10 key brain regions obtained by different measurement methods
[0316]
[0317] According to the data obtained in Table 1 and Table 2 in Example 2 and Example 3, the different scoring results of functional diarrhea patients and healthy control groups were counted, and the top 10 br...
PUM
 Abstract
Description
Claims
Application Information