Method for predicting distribution and ratio of sedimentary particles

A technology of particle distribution and sedimentation, applied in particle and sedimentation analysis, particle size analysis, measuring devices, etc., can solve the problems of high cost, unsatisfactory, ignoring silt and gravel deposition, etc., to achieve short time consumption, low cost, The effect of small human interference factors

Inactive Publication Date: 2017-07-18
YANGTZE UNIVERSITY
View PDF2 Cites 7 Cited by
  • Summary
  • Abstract
  • Description
  • Claims
  • Application Information

AI Technical Summary

Problems solved by technology
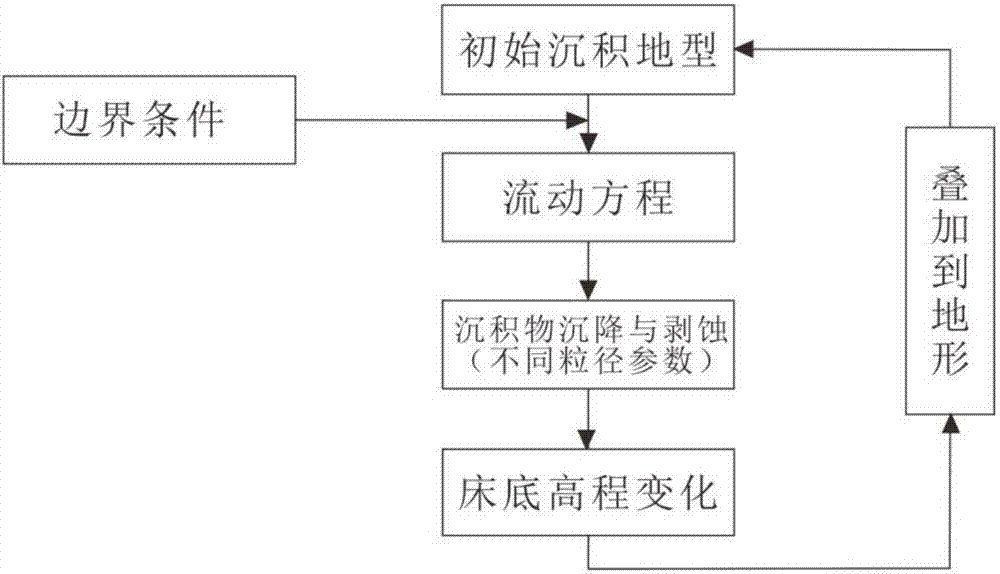
[0002] In traditional geological research, the physical simulation method is often used for the distribution and ratio of sediment particles, that is, the simulation results are sliced ​​through the tank experiment to observe the distribution of sediment particles; there are many defects in the tank experiment. First, the tank experiment Most of the sorted sand is used, and the sedimentation of silt and gravel is often ignored; secondly, the quantitative prediction of the scale and extension of the sand body is not enough for the flume experiment; in addition, the physical simulation experiment of a large flume is time-consuming, expensive, and requires more advanced The technical equipment and control system; the flume experiment itself has errors, coupled with the interference of human factors, the results obtained are often unsatisfactory
[0003] The existing patent number is 201510408099.3, and the patent name is "Automatic Processing Method of Seabed Sediment Grain Size Analysis Data", which mainly includes the actual operation platform and computer platform. The purpose is to analyze the particle size, and programming design is required. Analyze particle size distribution

Method used


Image

  • Method for predicting distribution and ratio of sedimentary particles
  • Method for predicting distribution and ratio of sedimentary particles
  • Method for predicting distribution and ratio of sedimentary particles

Examples


Embodiment

[0122] Set the simulation area as 150km×200km (length×width), slope to the basin with a slope of 0.002°, divide the river channel area into 500×10 grids, and the lake basin area into 100×200 grids. The number of grids is 30,000, and the grid scales in the x and y directions are both 100m; the boundary condition type of the inlet of the model is total discharge, and the boundary condition type of the outlet is water level. Other main parameters are shown in the following table:

[0123]

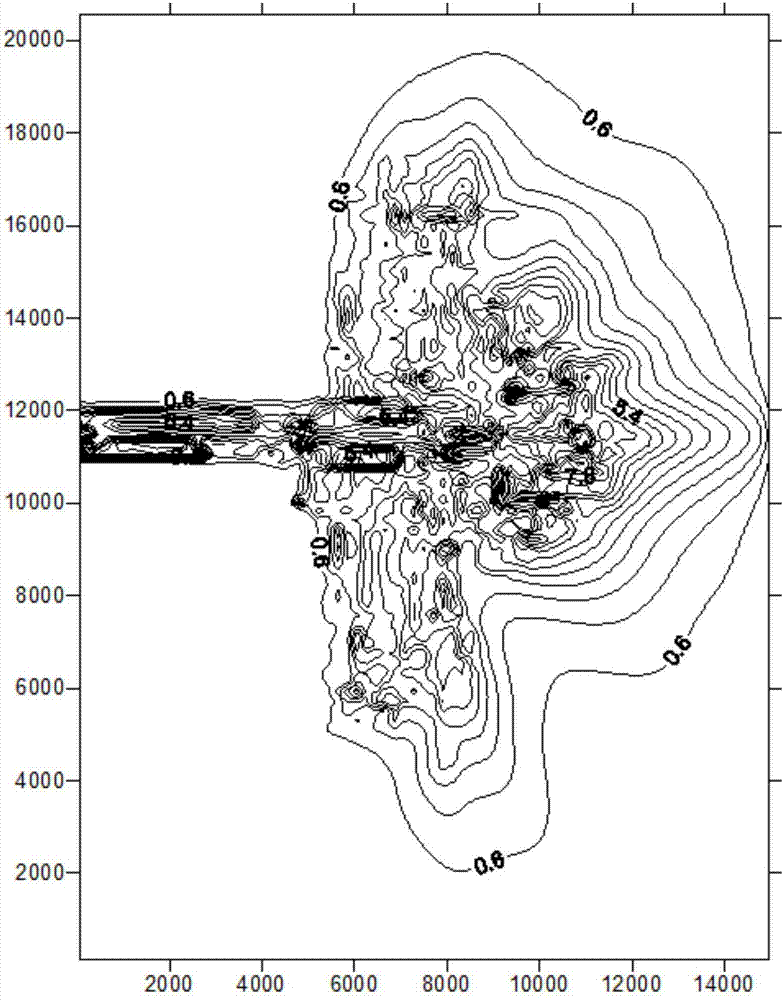
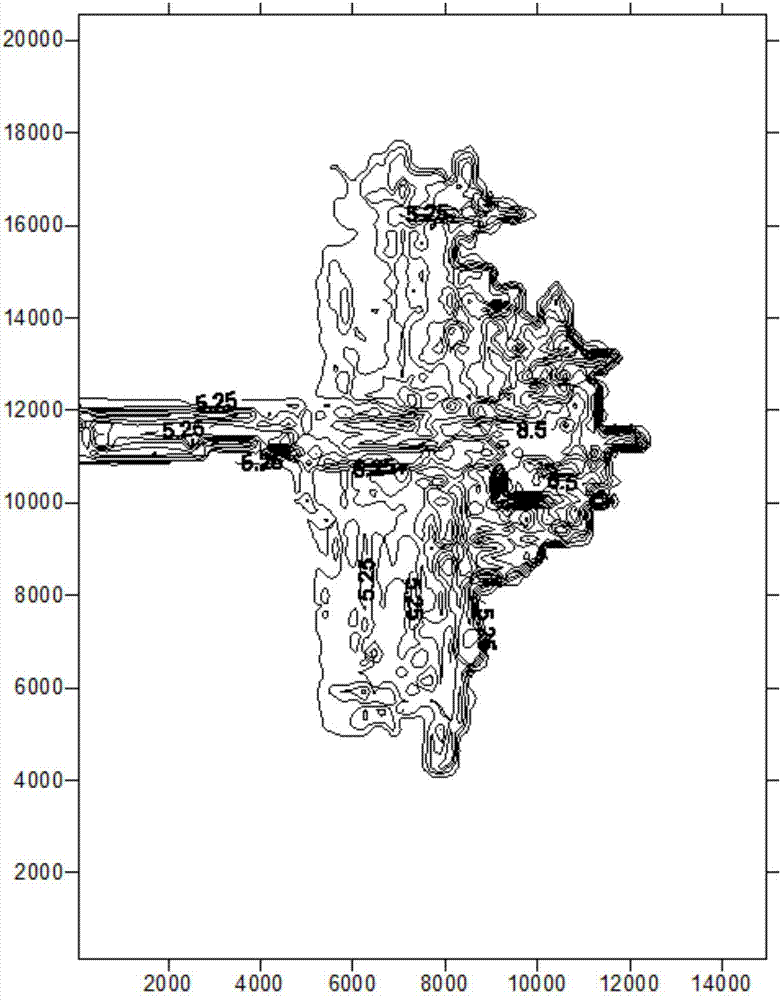
[0124] Set the simulation time to 1 year, and simulate by computer, the simulation result map can be obtained in only 5-7 days; the cost is low; select the time T=4405, and the mud thickness distribution map at the time T=4405 can be obtained (such as figure 2 as shown), sand 1 thickness distribution map (as shown image 3 As shown), sand 2 thickness distribution map (such as Figure 4 shown), mud content distribution map (such as Figure 5 As shown), sand 1 content distribution map (suc...


PUM


Abstract

The invention discloses a method for predicting distribution and ratio of sedimentary particles. The method comprises the following steps: analyzing the density of a rock sample according to research area sampling or core data, and analyzing granularity of the rock sample to obtain data, including density and particle size distribution, of sedimentary components; from the view of sedimentary dynamic characteristics of sedimentary sand bodies, carrying out sedimentology investigation, and determining structural geologic characteristics, including physiognomy, and sedimentary dynamic control factors of the sedimentary sand bodies in a research area; according to different carrying ways of the particles, dividing the sedimentary components into two types, and calculating volume of sediments according to simulation representations of the sedimentary components; repeating the steps until simulation is finished, so that quantitative representation on the research area is realized; extracting data of each component from a result map simulated by a computer, calculating thickness and percentage content of each component according to density data, drawing a thickness distribution diagram and a content distribution diagram of all the components, and thus finally realizing prediction of the distribution and ratio of the sedimentary particles. The method disclosed by the invention has the advantage of being better in line with the practical geological process.

Description

technical field [0001] The invention relates to the technical field of oil and gas exploration and development, more specifically a method for predicting the distribution and ratio of sediment particles. Background technique [0002] In traditional geological research, the physical simulation method is often used for the distribution and ratio of sediment particles, that is, the simulation results are sliced ​​through the tank experiment to observe the distribution of sediment particles; there are many defects in the tank experiment. First, the tank experiment Most of the sorted sand is used, and the sedimentation of silt and gravel is often ignored; secondly, the quantitative prediction of the scale and extension of the sand body is not enough for the flume experiment; in addition, the physical simulation experiment of a large flume is time-consuming, expensive, and requires more advanced The technical equipment and control system; the flume experiment itself has errors, co...

Claims


Application Information

Patent Timeline
Patent Type & Authority Applications(China)
IPC IPC(8): G01N15/02G01B21/08
CPCG01N15/02G01B21/08
Inventor 曾灿尹太举刘云华宋亚开严秀瑾
Owner YANGTZE UNIVERSITY
Why Eureka
Try Eureka