
Detection method of power grid false data injection attack based on nonlinear measurement equation

A technique for measuring equations and injecting attacks, which is applied in the direction of digital data protection, etc., can solve problems such as false data injection attack detection, and achieve the effect of saving calculation time and improving detection accuracy

Inactive Publication Date: 2021-04-20
新疆电力建设调试所有限责任公司 +2
View PDF2 Cites 0 Cited by
  • Summary
  • Abstract
  • Description
  • Claims
  • Application Information

AI Technical Summary

Problems solved by technology

[0003] The present invention provides a method for detecting false data injection attacks in power grids based on nonlinear measurement equations, which overcomes the above-mentioned deficiencies in the prior art, and can effectively solve the problem that existing detection methods for false data injection attacks cannot solve nonlinear measurement equations. The problem of detecting fake data injection attacks

Method used


Image

  • Detection method of power grid false data injection attack based on nonlinear measurement equation
  • Detection method of power grid false data injection attack based on nonlinear measurement equation
  • Detection method of power grid false data injection attack based on nonlinear measurement equation

Examples


Embodiment 1

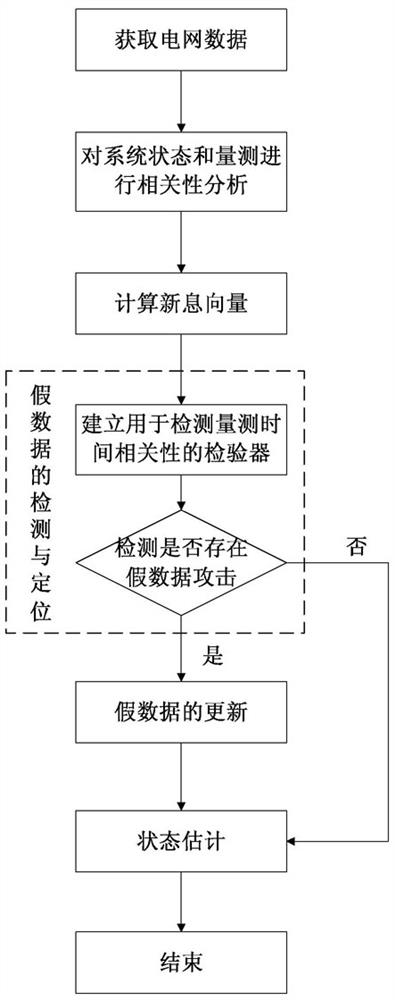
[0052] Embodiment 1: as attached figure 1 As shown, the power grid false data injection attack detection method based on the nonlinear measurement equation includes the following steps:

[0053] Step 1: Obtain grid data, the grid data includes grid topology, line parameters and historical state estimation data, wherein the grid topology includes the connection status between lines, switch opening and closing conditions; line parameters include line conductance and ground Susceptance, then enter the second step;

[0054] Step 2: Perform power grid system state correlation analysis and power grid system measurement correlation analysis; the power grid system state correlation analysis includes time correlation modeling of n-node systems and state prediction of n-node systems; the The power grid system measurement correlation analysis includes the time correlation between the current measurement value and the measurement prediction value, as follows:

[0055] (1) Carry out the ...

Embodiment 2

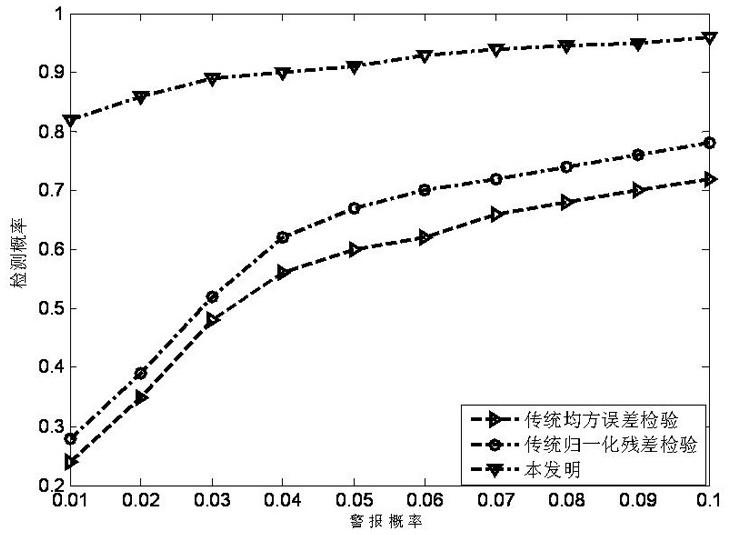
[0097] Embodiment 2: as attached figure 2 As shown, in the IEEE30 system, there are 86 SCADA measurements in the system. When the IEEE30 system is in stable operation (no sudden load change, generator failure, short circuit, etc.), the mean value of the SCADA measurement data is 0, and the standard deviation is 0.01 random Gaussian white noise; attack the phase angle of nodes 4 and 16, the attack range is 20% of the original value; detection threshold λ 1 =3; This emulation is under the Matlab environment and is configured as 2.5GHz, 8GB memory, and the processor is carried out on the computer of Core i5, and with the method of the present invention, traditional error mean square detection method, traditional normalization The residual error test method is used for detection at the same time.

[0098] The test results are attached figure 2 As shown, from attached figure 2 It can be seen that the detection effect of the method of the present invention is better than that ...


PUM


Abstract

The invention relates to the technical field of power grid data security, and is a method for detecting false data injection attacks on power grids based on nonlinear measurement equations, which includes the following steps: the first step: obtaining power grid data; The third step: calculate the innovation vector; the fourth step: false data detection and positioning; the fifth step: update the false data; the sixth step: state estimation; the present invention analyzes the power system state and quantity The correlation between measurements can effectively detect false data injection attacks that cannot be detected by the traditional method based on measurement residuals, and improve the detection accuracy; different from the traditional method of multiple iterative detection, it can detect all attacks at one time The attacked measurement effectively saves computing time and is suitable for online applications of power grids; it can locate specific malicious injected data and use the measured predicted value to update the measurement containing false data injection, ensuring that the state estimation can be run again to obtain the system accurate operating status.

Description

technical field [0001] The invention relates to the technical field of grid data security, and relates to a grid false data injection attack detection method based on nonlinear measurement equations. Background technique [0002] Smart grids widely use advanced measurement and sensing devices, such as (Phasor Measurement Unit) PMU and smart meters, which greatly improve the system's situational awareness and online monitoring capabilities, but at the same time face increasingly serious potential network security problems. Traditional power system state estimation is mainly to filter the real-time information provided by the data acquisition and monitoring system (SCADA) and PMU, so as to improve the data accuracy and eliminate the interference of wrong information, so as to obtain the real-time state database of the power system, and perform various tasks for the energy management center. This important control provides data support. So far, a relatively complete theoretica...

Claims


Application Information

Patent Timeline
Patent Type & Authority Patents(China)
IPC IPC(8): G06F21/60
CPCG06F21/60
Inventor 秦艳辉孙谊媊李德存沈中信刘威麟依力扎提吐尔汗高山闫亚岭王伟祁晓笑王琛焦春雷刘大贵孙冰王方楠罗忠游王四海祁伟
Owner 新疆电力建设调试所有限责任公司
Learn More