Seismic data inversion method and system
An inversion and data technology, applied in the field of geophysical exploration data processing, can solve the problems of high difficulty in determining scale factors and cycle jumps, and achieve the goals of avoiding the selection of non-physical scale factors, accurate long-wavelength static correction, and saving memory Effect
- Summary
- Abstract
- Description
- Claims
- Application Information
AI Technical Summary
Problems solved by technology
Method used
Image

Examples
example ( 1
[0098] Example (1) Synthetic test:
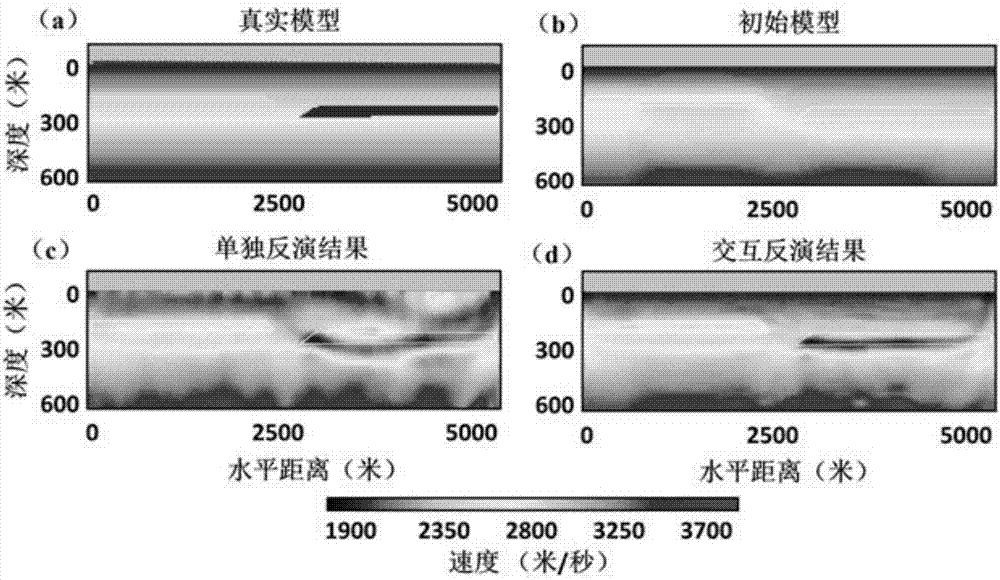
[0099] refer to figure 2 (a), figure 2 (a) is the artificially synthesized real velocity model, where the points at the top of the model in the figure represent the shot point and the receiver point respectively. The horizontal distance and depth of the model are 5000 meters and 600 meters respectively, and the grid is 10 meters square. The observation system includes 80 guns and 160 geophones, and the distance between the guns and the geophones is 60 meters and 30 meters, respectively. First arrival traveltime data and waveform data are obtained by ray tracing and finite difference methods, respectively.
[0100] refer to figure 2 (b), figure 2 (b) The initial model used in the subsequent inversion, which was established by first-arrival traveltime tomography. Seismic waveform data is decomposed into 8 scales by wavelet transform, the maximum scale is 8, the minimum scale is 1, let scale 0 be the original data. In this synthetic ...
example ( 2
[0104] Example (2) Actual data test:
[0105] This example uses a 2D land data set from a region. The geology of this region is very complex, making it difficult to image the region by seismic methods. The topography of the area varies drastically, with elevation changes ranging from 3,500 to 2,000 meters along the survey line from south to north. The survey line includes 211 shots and 1411 geophones in total, and the shot spacing and geophone spacing are 200 meters and 20 meters respectively. refer to Figure 5 (a), Figure 5 (a) is the initial model built for the subsequent inversion by first-arrival traveltime tomography. In this test, the preprocessed original waveform is divided into 10 scales, and the scales used for inversion are 6, 5, 4 and 0 respectively. Figure 5 (b) shows the results of individual inversions, Figure 5 (c) shows the final result of the interactive inversion based on the method of the present invention.
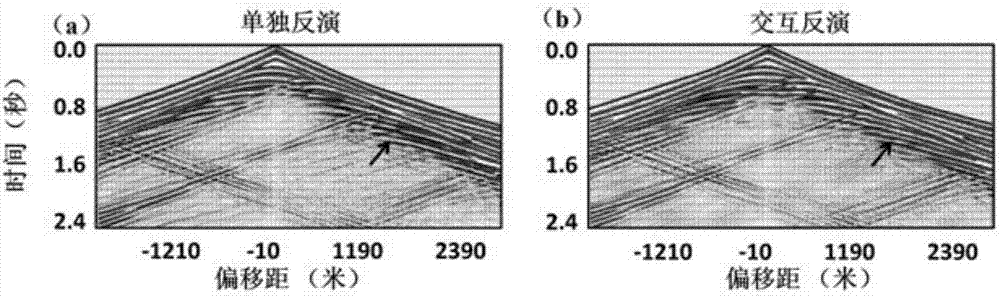
[0106] Image 6is a quality monitor ...
PUM
 Abstract
Description
Claims
Application Information
 - R&D
- Intellectual Property
- Life Sciences
- Materials
- Tech Scout
- Unparalleled Data Quality
- Higher Quality Content
- 60% Fewer Hallucinations
Browse by: Latest US Patents, China's latest patents, Technical Efficacy Thesaurus, Application Domain, Technology Topic, Popular Technical Reports.
© 2025 PatSnap. All rights reserved.Legal|Privacy policy|Modern Slavery Act Transparency Statement|Sitemap|About US| Contact US: help@patsnap.com