
Obtaining method of mapping relationship between spectrum and concentration

A mapping relationship and spectral technology, applied in the field of spectral analysis, can solve problems such as impure gas, complex operation and control, and complex analysis model devices

Active Publication Date: 2021-09-14
HANGZHOU PUYU TECH DEV CO LTD +1
View PDF5 Cites 0 Cited by
  • Summary
  • Abstract
  • Description
  • Claims
  • Application Information

AI Technical Summary

Problems solved by technology

[0005] Build SO 3 The device of the analysis model is relatively complicated, and it is necessary to precisely control the SO 2 Oxidation to SO 3 The reaction conditions are complex, the operation control is complex, and the generated SO 3 The gas is impure and contains SO 2 , O 3 and other gases, and SO 2 and SO 3 The high degree of spectral overlap seriously affects the accuracy of the FTIR analysis model

Method used


Image

  • Obtaining method of mapping relationship between spectrum and concentration
  • Obtaining method of mapping relationship between spectrum and concentration
  • Obtaining method of mapping relationship between spectrum and concentration

Examples


Embodiment 1

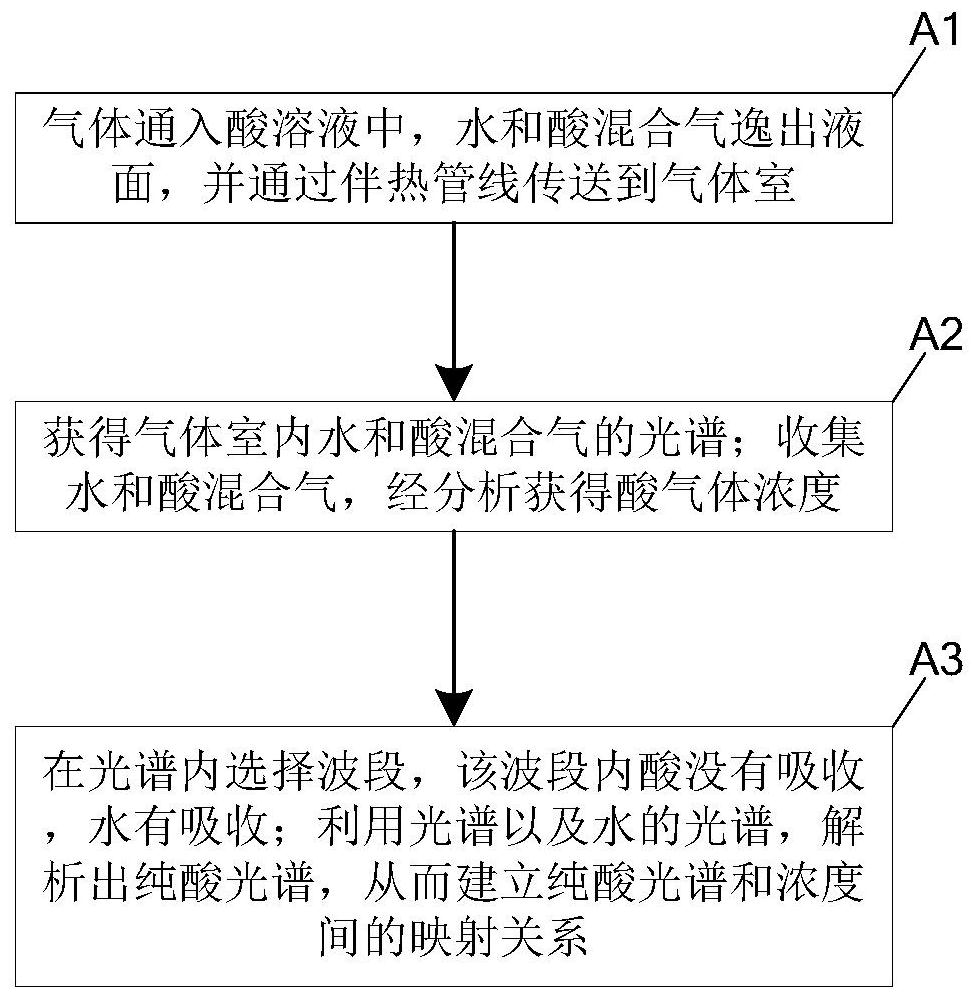
[0024] figure 1 A flowchart of a method for obtaining a mapping relationship between spectra and concentrations in an embodiment of the present invention is schematically given, as shown in figure 1 As shown, the method for obtaining the mapping relationship between the spectrum and the concentration comprises the following steps:

[0025] (A1) The gas is passed into the acid solution, and the mixed gas of water and acid escapes from the liquid surface and is sent to the gas chamber through the heating pipeline;

[0026] The temperature in the heating pipeline is greater than 100 degrees to prevent water condensation;

[0027] (A2) Obtain the spectrum of water and acid mixture in the gas chamber;

[0028] Collect the mixed gas of water and acid, if it is absorbed in the absorption bottle, detect the acid radical ion content M, and obtain the acid gas concentration after analysis V is the volume of absorbed water and acid mixture;

[0029] (A3) Select a band in the spectru...

Embodiment 2

[0034] An application example of the mapping relationship between spectrum and concentration according to Embodiment 1 of the present invention in sulfur trioxide.

[0035] The method for obtaining the mapping relationship between the spectrum and the concentration of the application example of the present invention comprises the following steps:

[0036] (A1) High-purity nitrogen gas is passed into the sulfuric acid solution, and the mixed gas of water and sulfuric acid escapes from the liquid surface and is sent to the gas chamber through the heating pipeline;

[0037] The concentration of the sulfuric acid solution is 82%-95%, the sulfuric acid container is at a constant temperature, such as 90 degrees, the temperature in the heating line is greater than 200 degrees, and the gas chamber is also heated to more than 200 degrees;

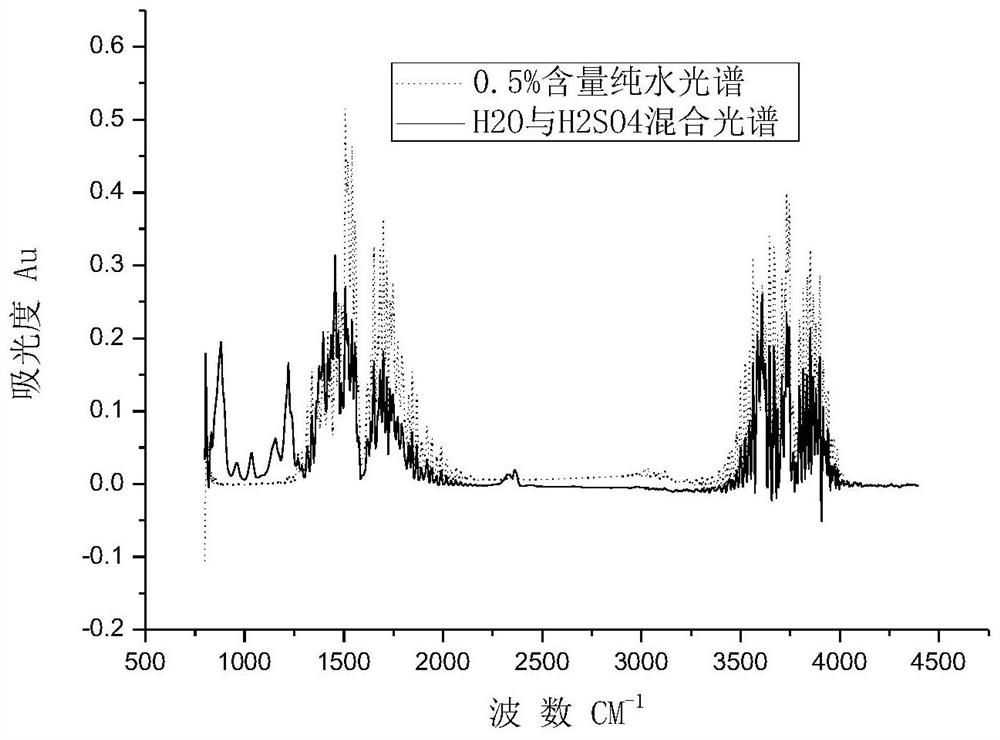
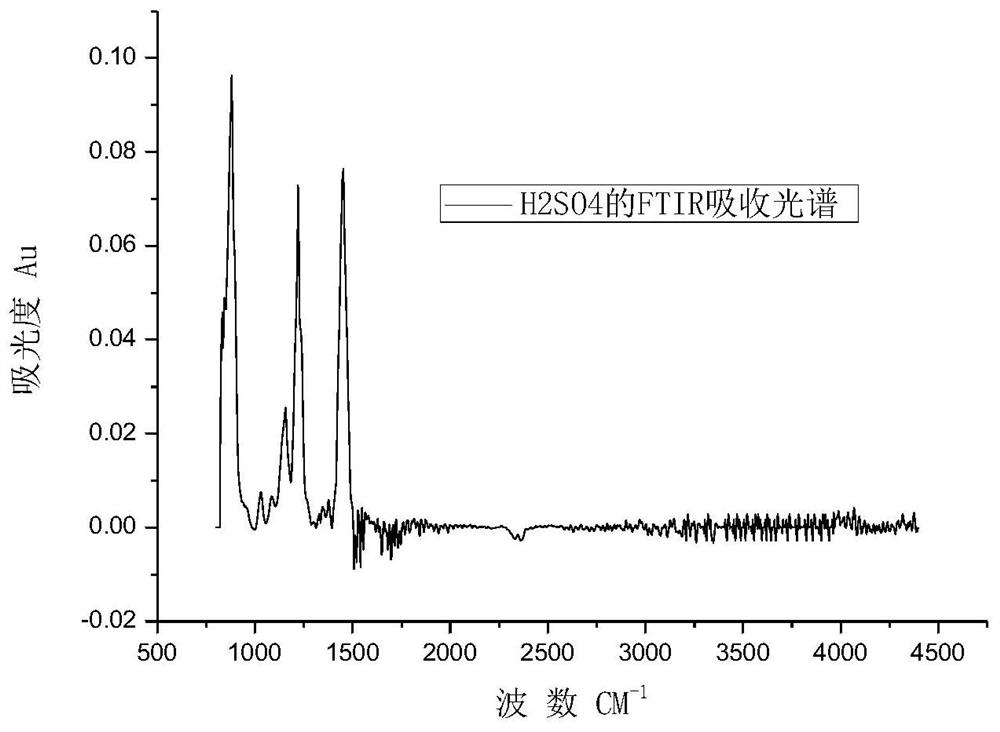
[0038] (A2) Utilize the Fourier transform spectrometer to obtain the spectrum of water and sulfuric acid mixture in the gas chamber, such as figu...


PUM


Abstract

The invention provides a method for obtaining the mapping relationship between the spectrum and the concentration. The method for obtaining the mapping relationship between the spectrum and the concentration comprises the following steps: (A1) the gas is passed into the acid solution, and the mixed gas of water and acid escapes from the liquid surface , and sent to the gas chamber through the heating pipeline; (A2) Obtain the spectrum of the water and acid mixture in the gas chamber; collect the water and acid mixture, and obtain the concentration value of the acid gas after analysis; (A3) Select a band within the spectrum , acid does not absorb in this band, but water has absorption; use the spectrum and the spectrum of water to analyze the spectrum of pure acid, so as to establish the mapping relationship between the spectrum of pure acid and the concentration. The invention has the advantages of accuracy, convenience and the like.

Description

technical field [0001] The invention relates to spectrum analysis, in particular to a method for obtaining the mapping relationship between spectrum and concentration. Background technique [0002] At present, only SO is detected for sulfur-containing gases in the detection of flue gas components. 2 , but part of the SO in the actual flue gas generation process 2 will be oxidized to SO 3 , this part of the sulfur-containing gas has a ratio of SO 2 Stronger haze-forming ability, so for SO in flue gas emission 3 monitoring is very necessary. [0003] Currently for SO in flue gas 3 The content monitoring method generally adopts GB / T 21508-2008 Coal-fired flue gas desulfurization equipment performance test method Appendix C SO in flue gas 3 method of concentration determination. The method is a chemical determination method, and the operation is cumbersome and complicated. [0004] In addition, a method for monitoring SO by FTIR infrared absorption method was reported. ...

Claims


Application Information

Patent Timeline
Patent Type & Authority Patents(China)
IPC IPC(8): G01N21/31
CPCG01N21/31
Inventor 周新奇郭中原陈文益郑启伟洪波慎石磊俞晓峰
Owner HANGZHOU PUYU TECH DEV CO LTD
Learn More