In-situ detection method and device for electrode current density distribution of flow battery
An in-situ detection, flow battery technology, applied in the detection field, can solve the problems of battery operation interference, limited spatial resolution, complex and cumbersome, and achieve the effect of improving battery performance
- Summary
- Abstract
- Description
- Claims
- Application Information
AI Technical Summary
Problems solved by technology
Method used
Image
Examples
Embodiment 1
[0043] In situ detection of current density distribution of flow battery electrodes under different flow fields.
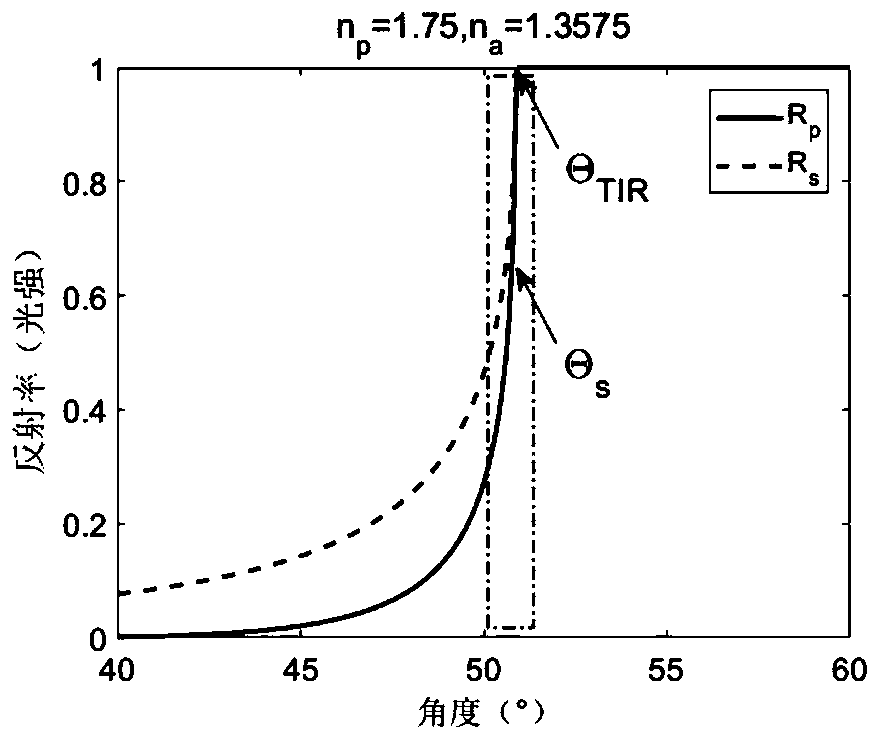
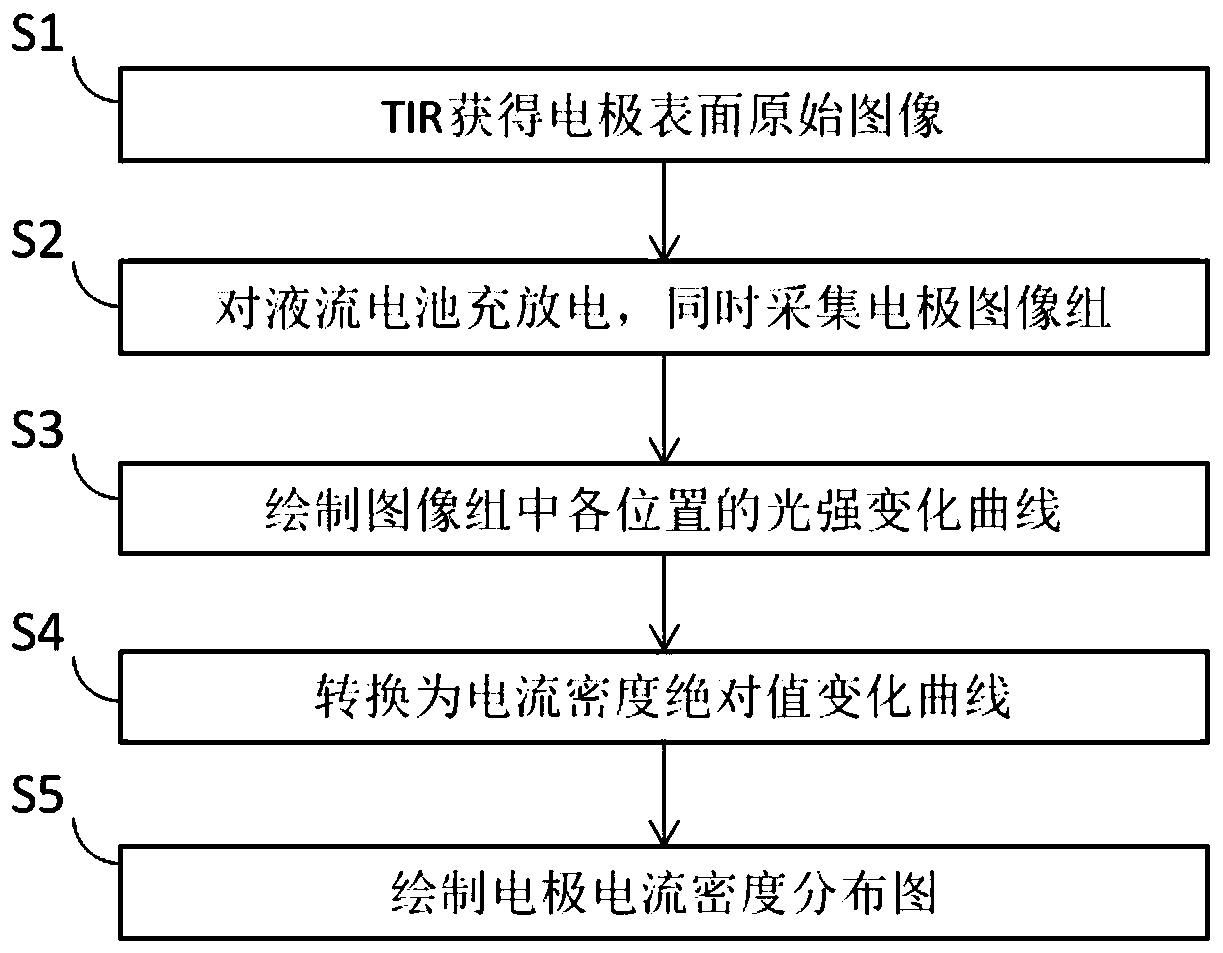
[0044] Such as Figure 7a As shown, first adjust the TIR system to produce a clear image S1 of the electrode; then collect the electrode image group S2 during the charging and discharging process of the flow battery, each image includes several pixels, such as points A and B in the figure, and take the Draw the light intensity-time series curve at the same pixel point of each image, and draw all pixels, Figure 7a Curve S3 drawn for pixel point B in . It can be seen that the light intensity curve at point B corresponds to the charging and discharging process and changes periodically. According to the relationship between the total reflection angle and the current density and the total reflection angle and the light intensity, the light intensity-time series curve is converted into the current density absolute value-time curve S4. In the experiment, the absolute...
Embodiment 2
[0047] In situ detection of electrode activity differences across different electrodes.
[0048] In the case of ensuring that the flow field distribution of the electrolyte remains unchanged, replace electrodes with different activities. In this embodiment, carbon felts are used as electrodes, and three carbon felts with different activities are replaced. For each carbon felt, Figure 7a Steps to obtain the current density map of the electrode, and then obtain the current density distribution maps R1, R2, R3 of three different activated carbon felts. Then the influence of the flow field distribution of the electrolyte is removed respectively, and the current density distribution diagrams RD1, RD2 and RD3 influenced by different electrode activity distributions are obtained. Figure 7c In , the change of the thickness of the lines indicates that there is a difference in the carbon felt activity.
PUM
 Abstract
Description
Claims
Application Information
 - R&D
- Intellectual Property
- Life Sciences
- Materials
- Tech Scout
- Unparalleled Data Quality
- Higher Quality Content
- 60% Fewer Hallucinations
Browse by: Latest US Patents, China's latest patents, Technical Efficacy Thesaurus, Application Domain, Technology Topic, Popular Technical Reports.
© 2025 PatSnap. All rights reserved.Legal|Privacy policy|Modern Slavery Act Transparency Statement|Sitemap|About US| Contact US: help@patsnap.com


