
Factory production state abnormity detection model design method

An anomaly detection and model design technology, applied in the field of detection, can solve problems such as difficult to meet the rapid changes in the actual operation status of the factory, and achieve the effect of convenient and refined management and decision-making basis

Pending Publication Date: 2019-10-08
上海新增鼎网络技术有限公司
View PDF4 Cites 1 Cited by
  • Summary
  • Abstract
  • Description
  • Claims
  • Application Information

AI Technical Summary

Problems solved by technology

According to the above problems and shortcomings, it is difficult to use conventional classification supervised learning algorithms to meet the rapid changes in the actual operating status of the factory

Method used


Image

  • Factory production state abnormity detection model design method
  • Factory production state abnormity detection model design method
  • Factory production state abnormity detection model design method

Examples


Embodiment 1

[0024] Example 1: See Figure 1-4 , a method for designing an abnormality detection model of a factory production state, comprising the following steps:

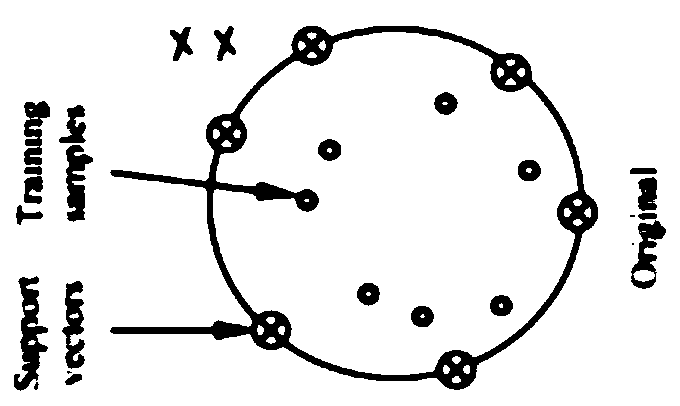
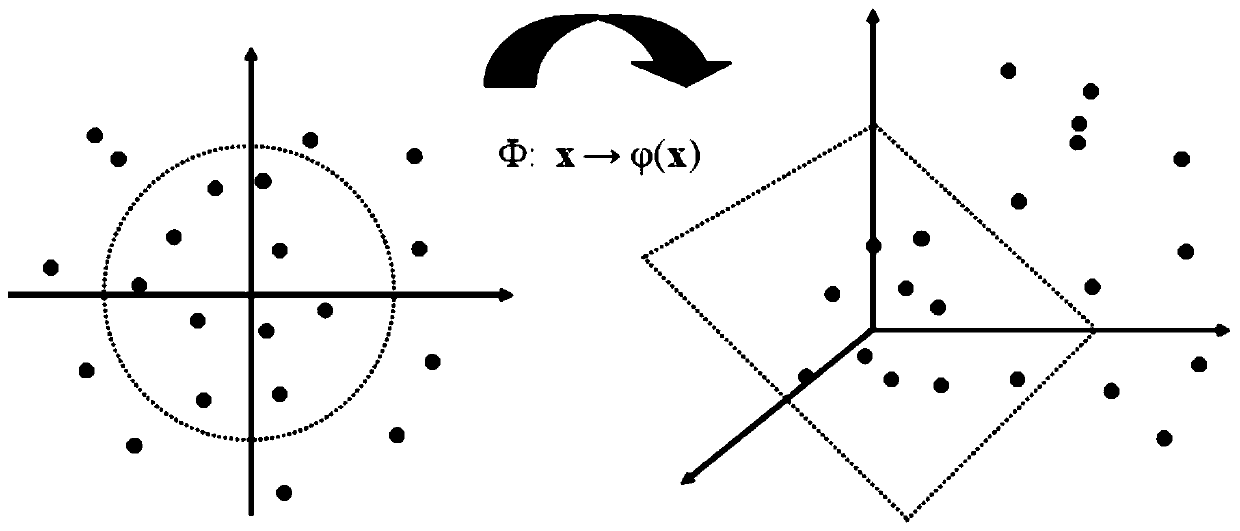
[0025] A, build support vector field; Described step A is specifically: construct sphere field, assume sphere center position a and sphere radius R, set up minimum radius function: Among them, C is a variable between the size of the coordination sphere and the error of the target object, and the constraints are: (x i -a) T (x i -a)≤R 2 +ξ i , ξ i ≥0, combine the above two formulas to create the Lagrangian function: where a i ≥0 and γ i ≥0, according to the above function, the following new constraints are obtained: C-a i -γ i =0, that is, the final Lagrangian function is as follows: By optimizing the solution to the minimization of L, it can be obtained that when the new test set data enters the model, whether it belongs to the normal category range, that is Among them, z is the new instance data.

[002...


PUM


Abstract

The invention discloses a factory production state abnormity detection model design method. The method comprises the following steps: A, constructing a support vector domain; B, designing a nonlineargeneralized kernel function support; C, setting early warning scores; D, evulating a model. A factory overall condition monitoring system can be established, production condition real-time monitoringabnormity monitoring and early warning can be achieved, more convenient refined management and decision-making bases are provided for relevant subjects, and the method is beneficial to combination ofbig data and artificial intelligence in the industrial manufacturing industry and has very important significance for enterprise development and national development.

Description

technical field [0001] The invention relates to the technical field of detection, in particular to a method for designing an abnormal detection model of a factory production state. Background technique [0002] At present, the evaluation of factory production and operation status usually uses classification algorithms to classify different operating conditions. The main task of these algorithmic programs is to use the model generated with labeled training data to distinguish the category to which the test data belongs, which belongs to supervised learning, which is used to analyze data and recognize patterns. The labeling of training data is usually judged by humans, and the limited indicators are scored separately, and combined with certain predetermined rules to give a comprehensive evaluation, such as product output, raw material inventory, power consumption, furnace temperature, machine vibration and other indicators . The algorithm uses the above labeled instance data...

Claims


Application Information

Patent Timeline
IPC IPC(8): G06Q10/06G06K9/62G06Q50/04
CPCG06Q10/06393G06Q50/04G06F18/2411Y02P90/30
Inventor 薛罡李会文刘琼万波朱跃飞程宏
Owner 上海新增鼎网络技术有限公司
Learn More