
Power system dynamic security assessment comprehensive model and spatiotemporal visualization method

A dynamic safety and power system technology, applied in electrical components, circuit devices, AC network circuits, etc., can solve the problems of large amount of calculation, unintuitive presentation of dynamic safety evaluation results, and high computer time consumption, reducing the training burden and reducing the cost of training. Predicting performance online, overcoming limitations

Active Publication Date: 2019-10-08
CHINA THREE GORGES UNIV
View PDF8 Cites 24 Cited by
  • Summary
  • Abstract
  • Description
  • Claims
  • Application Information

AI Technical Summary

Problems solved by technology

[0004](1) The traditional mechanism analysis method is mainly based on offline analysis, which has a large amount of calculation, high computer time consumption, and is difficult to meet the requirements of real-time dynamic security assessment for calculation speed. Provides stability margin information and many other deficiencies;
[0005](2) Traditional data-driven methods have many limitations when they are directly used to process large-scale data of modern power grids, and often have not considered the possible impact on dynamic security assessment Affected by various influencing factors in the operation of the power system and the efficiency of the training sample set, the dynamic security assessment results are not intuitive, and cannot provide visual dynamic security information
[0008]① The dynamic safety degree of the power system cannot be seamlessly given according to the real-time operation information of the power system;
[0009]② Unable to provide quantitative dynamic security information for the global or local areas of the power system;
[0010]③ Unable to provide power system operators with a visual dynamic safety monitoring map

Method used


Image

  • Power system dynamic security assessment comprehensive model and spatiotemporal visualization method
  • Power system dynamic security assessment comprehensive model and spatiotemporal visualization method
  • Power system dynamic security assessment comprehensive model and spatiotemporal visualization method

Examples


Embodiment 1

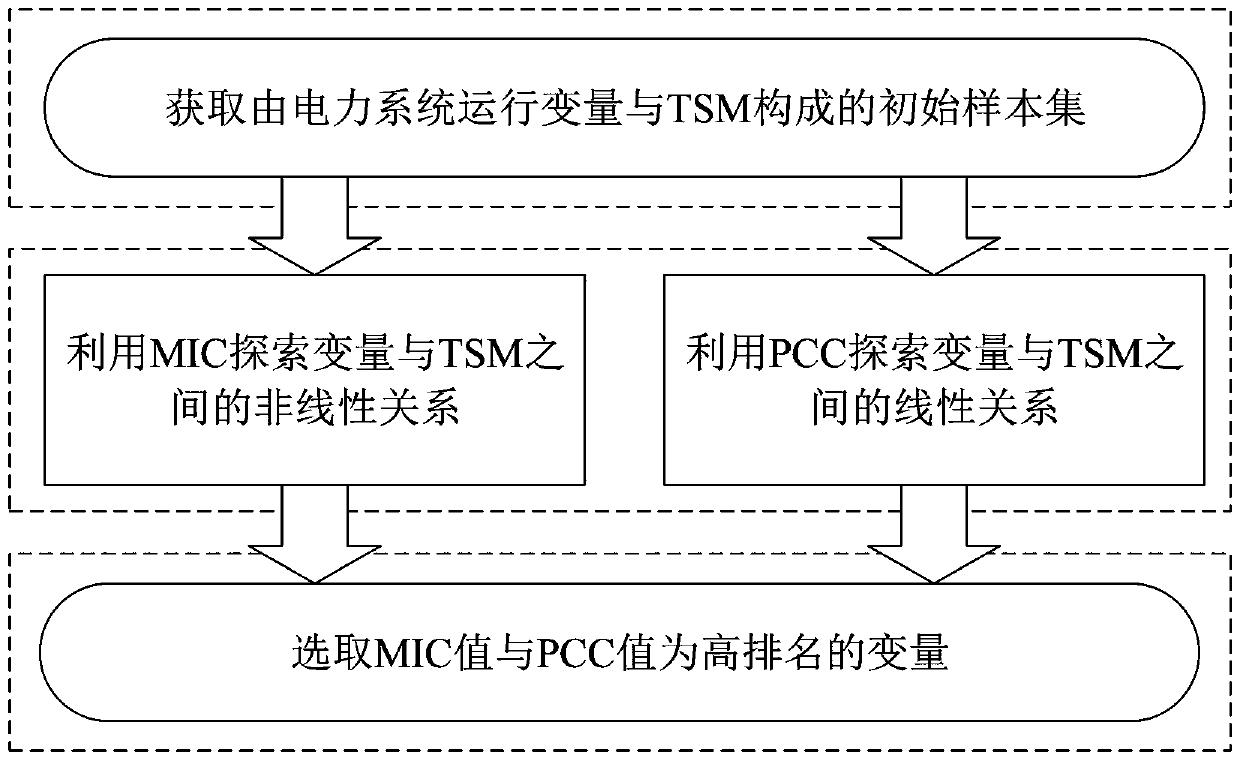
[0092] Embodiment 1: The first embodiment used in the present invention is based on the 23-node system provided by the power system simulation software PSS / E. The system includes 23 nodes, 6 generators, 10 transformers and other system components. This test includes all steps described in the method of the present invention, by testing on a computer equipped with an Intel Core i7 processor and 8GB memory, and obtained the test results. This test obtained 4510 initial sample sets, selected MIC value and ρ as the top 5% variables among all variables as features, used 80% of the sample set for training, and the remaining 20% ​​for performance testing, after 5 times Cross-validation yielded stable results. Using R 2 and RMSE to evaluate the prediction performance, the calculation formula is as follows:

[0093]

[0094]

[0095] In the formula: Y i for the actual TSM i value; Y i * is the predicted value of the regression model; for Y i The average value of ; m is ...

Embodiment 2

[0098] Embodiment 2: The second embodiment used in the present invention is based on the actual 1648-node system provided by the power system commercial simulation software PSS / E. The system contains 1648 nodes, 313 generators, 182 shunts, 2294 transmission lines and other system elements. The test hardware conditions are the same as in Example 1. This test has obtained 15375 initial sample sets, including 37439 variables involved in the present invention. The MIC value and ρ are selected as the top 0.1% variables in all variables. 80% of it is used for training, and the remaining 20% ​​is used for performance testing. After 5-fold cross-validation, stable results are obtained. The test accuracy of the final model reaches R 2 = 0.9865, RMSE = 0.0197.

[0099] In order to verify whether the processing speed of the model can meet the seamless online dynamic security assessment, the processing speed tests were performed on both systems, and the results are as follows: Image 6...


PUM


Abstract

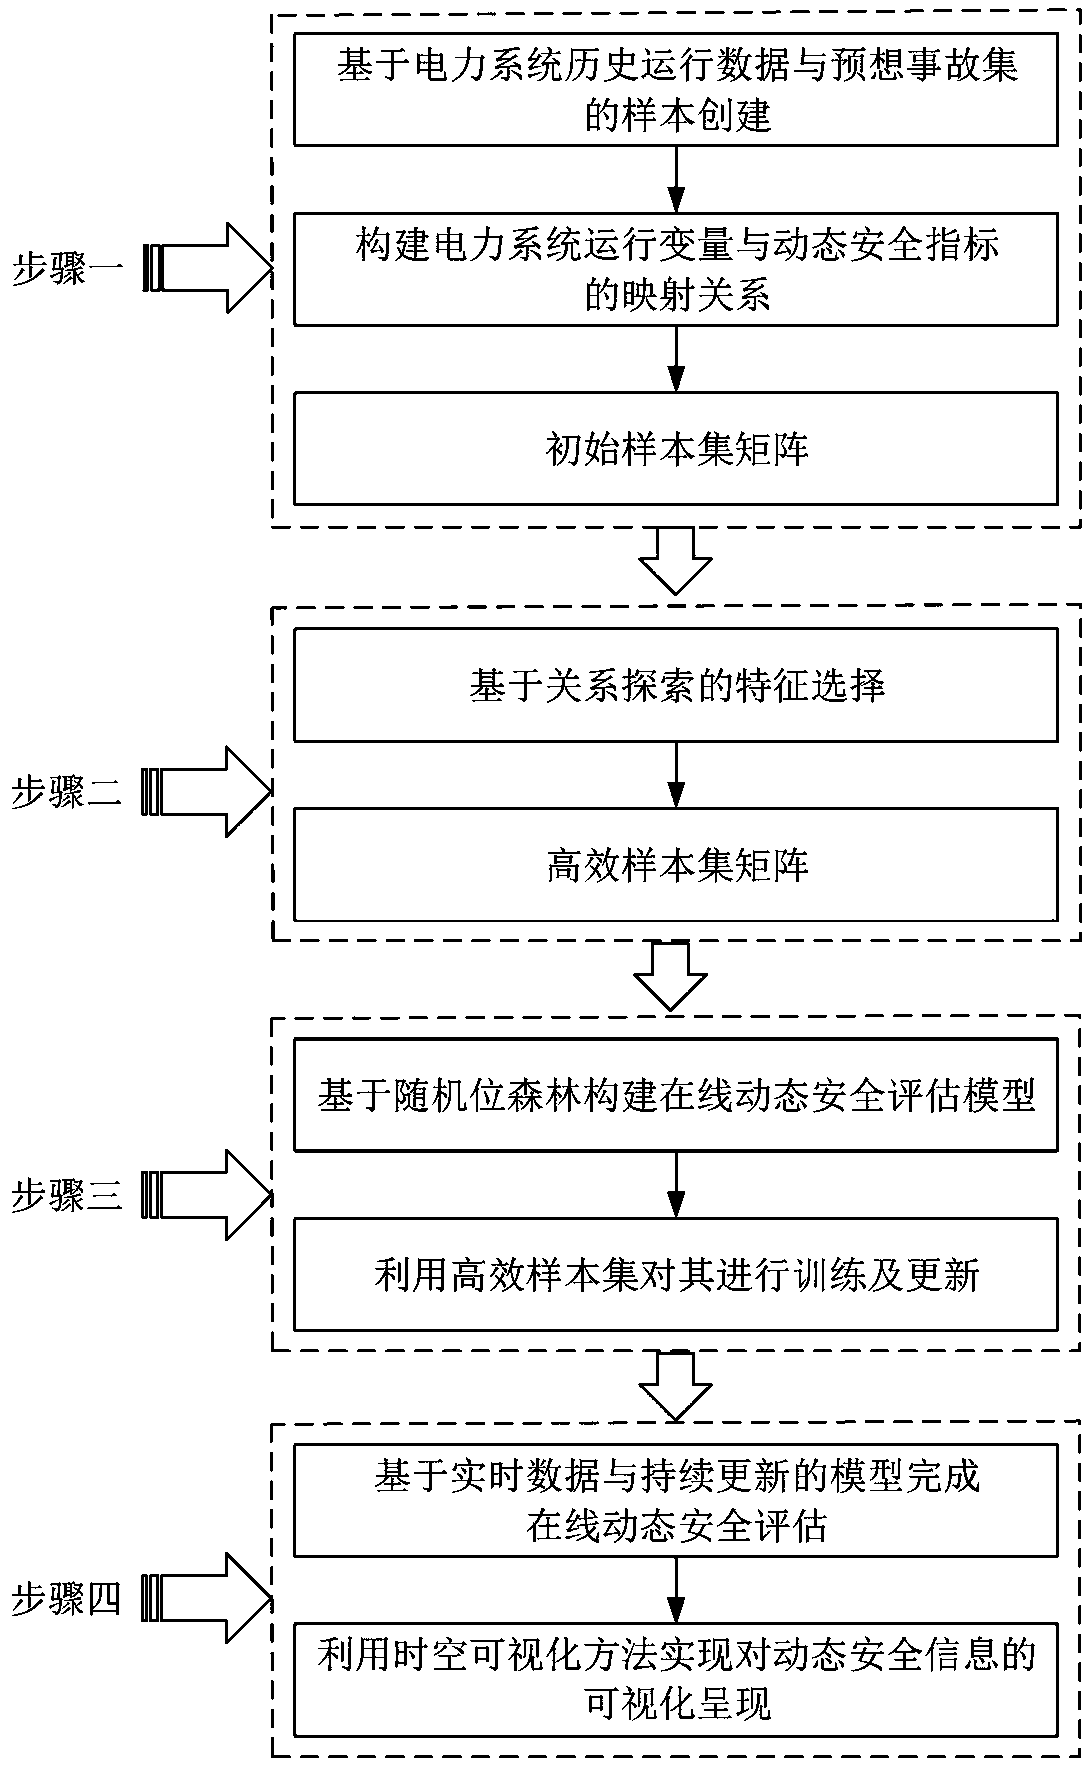
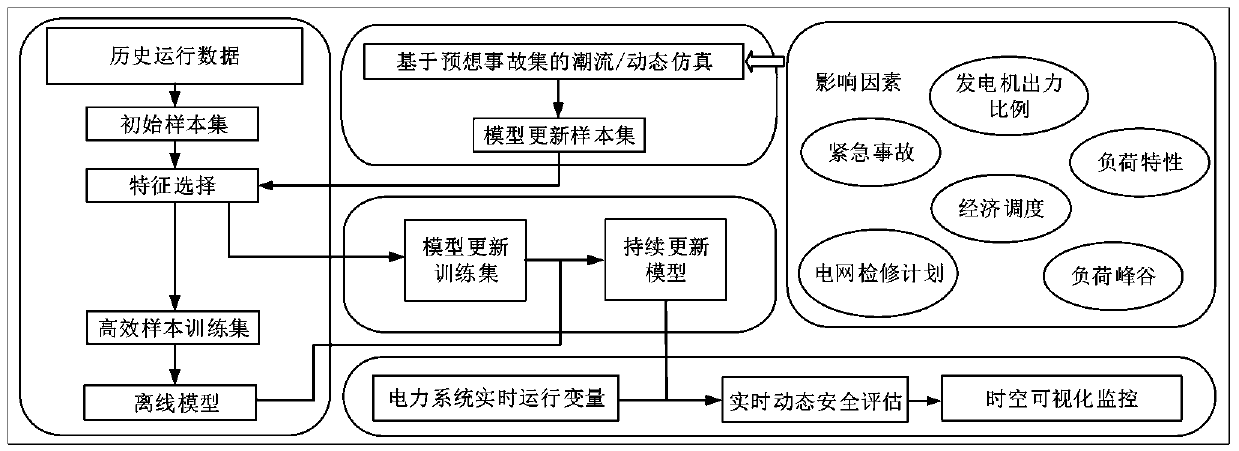
The invention provides a power system dynamic security assessment comprehensive model and a spatiotemporal visualization method. The method comprises the following steps: constructing a dynamic security index and establish an initial sample set for dynamic security assessment based on the historical operation data of a power system and a predicted accident set; 2) constructing a feature selectionframework, performing feature selection on the initial sample set and forming a processed high-efficiency sample set; 3) constructing an online dynamic security assessment comprehensive model based ona random bit forest and performing offline training and updating on the model by using the high-efficiency sample set; and 4) using the continuously updating dynamic security assessment model to complete the online assessment of the dynamic security state and using the spatiotemporal visualization method to realize the visual presentation of the dynamic security information. The purpose of the present invention is to provide the online dynamic security assessment comprehensive model and the spatiotemporal visualization method which are beneficial to the system operators to take timely preventive and control measures, avoid large power outage caused by accidents and improve the secure operation level of the power grid.

Description

technical field [0001] The invention relates to the field of dynamic security assessment of electric power systems, in particular to a comprehensive model and space-time visualization method for dynamic security assessment of electric power systems. Background technique [0002] On the one hand, with the popularization of new energy in the power system and the interconnection of large-scale power grids across regions, the safe operation of modern power systems is facing major challenges. The operating environment of the power system is complex and changeable, and potential emergencies increase the dynamic unsafe risk of the power grid. On the other hand, with the development of smart grid and wide-area measurement system, to make full use of the continuously accumulated and updated power system operation data, the dynamic security assessment method is required to have wider applicability and fast data processing speed. Therefore, the study of dynamic security assessment met...

Claims


Application Information

Patent Timeline
IPC IPC(8): H02J3/00G06F17/50
CPCH02J3/00G06F30/367H02J2203/20
Inventor 刘颂凯刘礼煌毛丹李欣杨楠郭攀锋程江洲杨苗邱立粟世玮李丹陈曦卢云
Owner CHINA THREE GORGES UNIV
Learn More