Full-automatic low-vision false image color filter array mode design method
A color filter and pattern design technology, applied to color TV, color TV parts, picture signal generator, etc., can solve the problems of complex calculation and easy visual artifacts, and achieve less computational complexity, less error, The effect of reducing the error
- Summary
- Abstract
- Description
- Claims
- Application Information
AI Technical Summary
Problems solved by technology
Method used
Image

Examples
Embodiment 1
[0068] This embodiment takes the color filter array pattern whose input size is 4×4 as an example to explain the implementation process of the design method of the present invention.
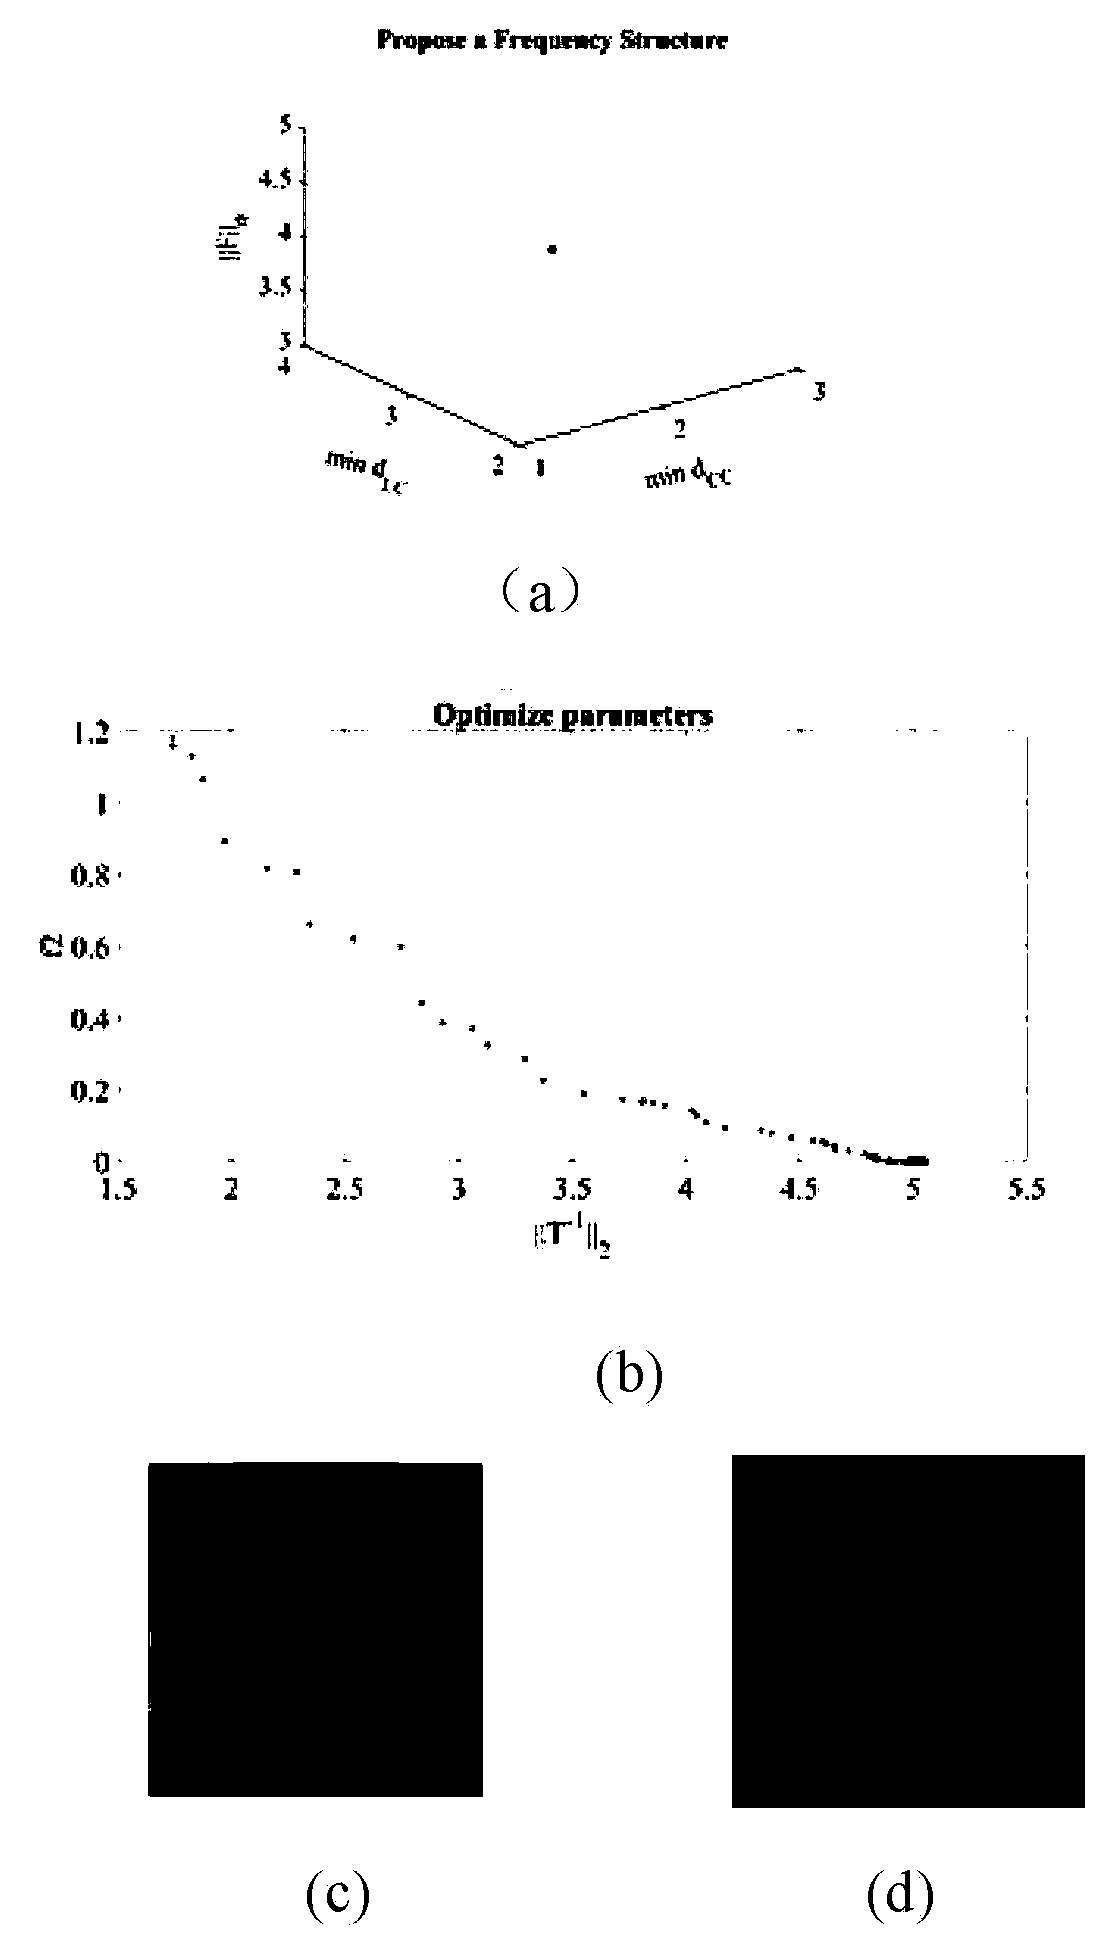
[0069] The initial form of the input frequency structure is Brightness component F L at point (1,1). Except for the horizontal axis and the vertical axis of the luma component position, the remaining positions of 0 are all candidate positions of the chrominance component. Using NSGA-Ⅱ to solve, the obtained Pareto front surface is as follows figure 1 as shown in a. Among them, the x-axis represents the minimum value of the distance between the luma component and the chroma component, the y-axis represents the minimum value of the distance between the chroma components, and the z-axis represents the number of non-zero aliasing components. Choose the solution that minimizes the number of non-zero aliasing components. Because the aggregation of chrominance components in the frequency domain s...
Embodiment 2
[0082] This embodiment is an embodiment of designing a color filter array of 9*9, and this embodiment obtains the optimal color filter array pattern such as Figure 5 As shown, the color values are:
[0083]
[0084]
[0085]
[0086] Its spectrogram is as Figure 6 As shown, using the 9*9 color filter array of the embodiment of the present invention and respectively Figure 4 The Bayer, Hirakawa, Hao, and Condat color filter arrays shown in (a), (b), (c), and (d) collect all 24 pictures in the Kodak dataset, and then use LSLCD to demosaic the 24 pictures, and finally Comparing the signal-to-noise ratio (CPSNR) of the 24 pictures with the real picture is shown in Table 1, and better values are marked in bold. It can be seen from Table 1 that the optimal CPSNR of each picture is not concentrated in a certain CFA, but scattered among the five CFAs participating in the comparison. When collecting pictures #1, #3, #6, #10, #12, #13, #17, #18, #22, #24, the performa...
PUM
 Abstract
Description
Claims
Application Information
 - R&D Engineer
- R&D Manager
- IP Professional
- Industry Leading Data Capabilities
- Powerful AI technology
- Patent DNA Extraction
Browse by: Latest US Patents, China's latest patents, Technical Efficacy Thesaurus, Application Domain, Technology Topic.
© 2024 PatSnap. All rights reserved.Legal|Privacy policy|Modern Slavery Act Transparency Statement|Sitemap