
Method for measuring, calculating and comparing relative average concentration of flying dust particles in similar areas in city

A technology of relative concentration and average concentration, applied in particle suspension analysis, measurement device, suspension and porous material analysis, etc., can solve the problem of no good selectivity of fugitive dust, and achieve wide measurement range, accurate results, and simple measurement process. Effect

Active Publication Date: 2019-11-22
YANGZHOU UNIV
View PDF14 Cites 1 Cited by
  • Summary
  • Abstract
  • Description
  • Claims
  • Application Information

AI Technical Summary

Problems solved by technology

These methods of measuring the concentration of particulate matter in the atmosphere have no good selectivity for dust, and the measured concentration of particulate matter includes PM2.5 and PM10, etc.

Method used


Image

  • Method for measuring, calculating and comparing relative average concentration of flying dust particles in similar areas in city
  • Method for measuring, calculating and comparing relative average concentration of flying dust particles in similar areas in city
  • Method for measuring, calculating and comparing relative average concentration of flying dust particles in similar areas in city

Examples


Embodiment 1

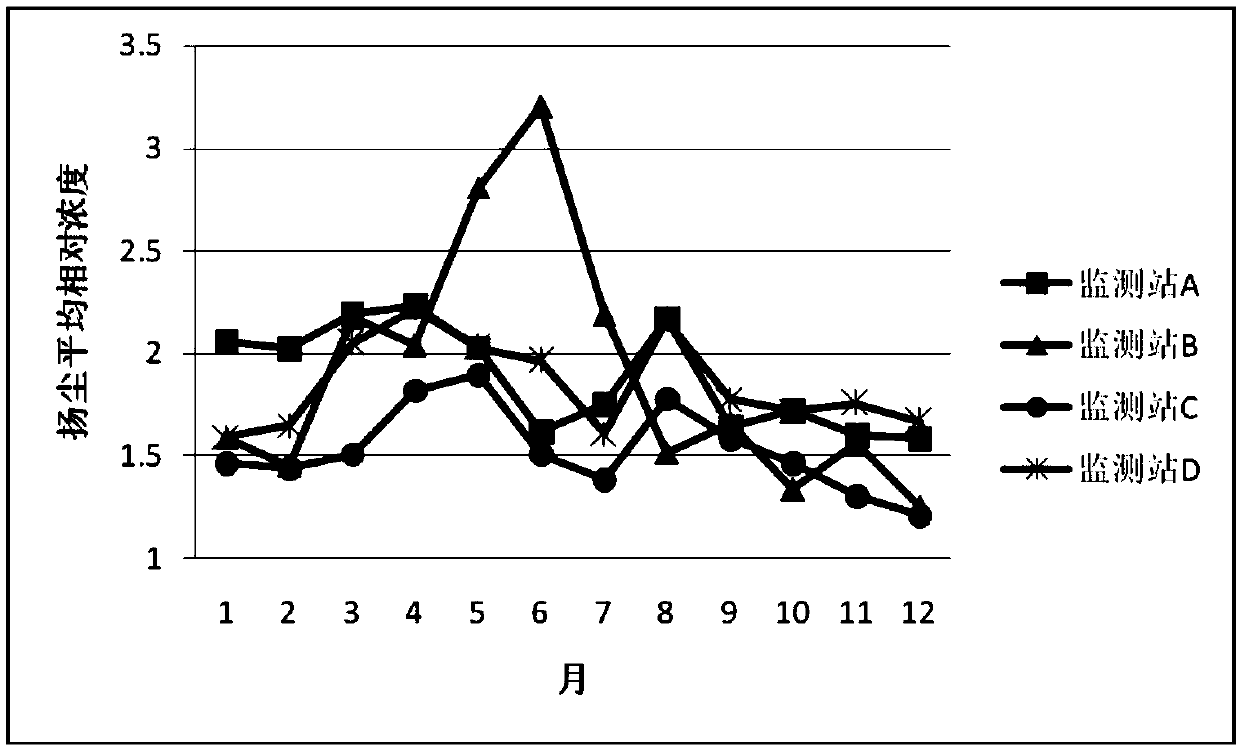
[0035] Take the monthly change of the average relative concentration of dust at four monitoring stations in an urban area in 2016 as an example.

[0036] 1) Continuously measure PM10 and PM2.5 for 24 hours, and record the average value every hour;

[0037] 2) Calculate the average concentration values ​​of PM10 and PM2.5 at each site within a month, see Table 1;

[0038] 3) Calculate the monthly average relative dust concentration of each site by formula (1), see Table 1;

[0039] 4) Draw the monthly change chart of the average relative concentration of dust, see figure 1 .

[0040] From Table 1 and figure 1 It can be seen that the annual average relative dust concentration near monitoring station A is the highest, the annual average relative dust concentration near monitoring station C is the lowest, and the average relative dust concentration of monitoring station B is particularly high from May to July, which is consistent with the maintenance of the east and west sides ...


PUM


Abstract

The invention discloses a method for measuring, calculating and comparing the average relative concentration of flying dust particles in similar areas in a city, and the method comprises the followingsteps: continuously measuring the average concentration of PM2.5 and PM10 in the atmosphere in real time in a measured area X; calculating the average relative concentration [YC]X of raised dust in the atmosphere in a time interval a or a period a in the measured area X; calculating the average relative concentration [YC]y of flying dust in the atmosphere in the same time interval or in the sametime period in other areas similar to the measured area X, wherein y in the [YC]y represents the serial number of other areas similar to the measured area X; comparing the [YC]X with the [YC]y, and judging the pollution degree of flying dust in the same time interval or the same period in the similar areas as the flying dust constants of the Kyc areas in the similar areas are similar or equal; andjudging the direction of the flying dust source by comparing the average relative concentration of the flying dust in the same time interval or the same period in the similar area and changing the wind direction. The method has the advantages that the measuring and calculating process is simple and convenient, the measuring and calculating range is wide, the actual condition is better met, and the result is more accurate.

Description

technical field [0001] The invention relates to the technical fields of environmental protection and air pollution prevention and control, in particular to the measurement and comparison of the relative average concentration of dust particles in similar areas in cities. Background technique [0002] Flying dust is a pollutant that enters the atmosphere due to the dust on the ground driven by the wind, and is an important part of the total suspended particulate matter in the ambient air. In many northern cities, dust is the main source of PM2.5. In East China, dust contributes about 10% to PM2.5. Near construction and road construction sites, dust contributes even more to PM2.5. [0003] In order to control the dust, many cities have strictly controlled the construction sites, and purchased many sprinklers and sprinklers to spray water on the roads in a cycle. There are many literatures reporting on the composition and sources of urban dust, but there are few reports on the ...

Claims


Application Information

Patent Timeline
Patent Type & Authority Applications(China)
IPC IPC(8): G01N15/06
CPCG01N15/06
Inventor 胡效亚徐琴
Owner YANGZHOU UNIV
Learn More