Variable well inclination and visual oil well sand control evaluation experimental device and method
A technology for visualizing oil wells and experimental devices, which is applied in wellbore/well components, earthwork drilling, and fluid production, etc. It can solve the problems of underground wellbore access, rarity of large-scale physical models, and the reliability of experimental results is open to question, and achieve experimental results. Reliable, optimized construction parameters, improved development effect
- Summary
- Abstract
- Description
- Claims
- Application Information
AI Technical Summary
Problems solved by technology
Method used
Image
Examples
Embodiment 1
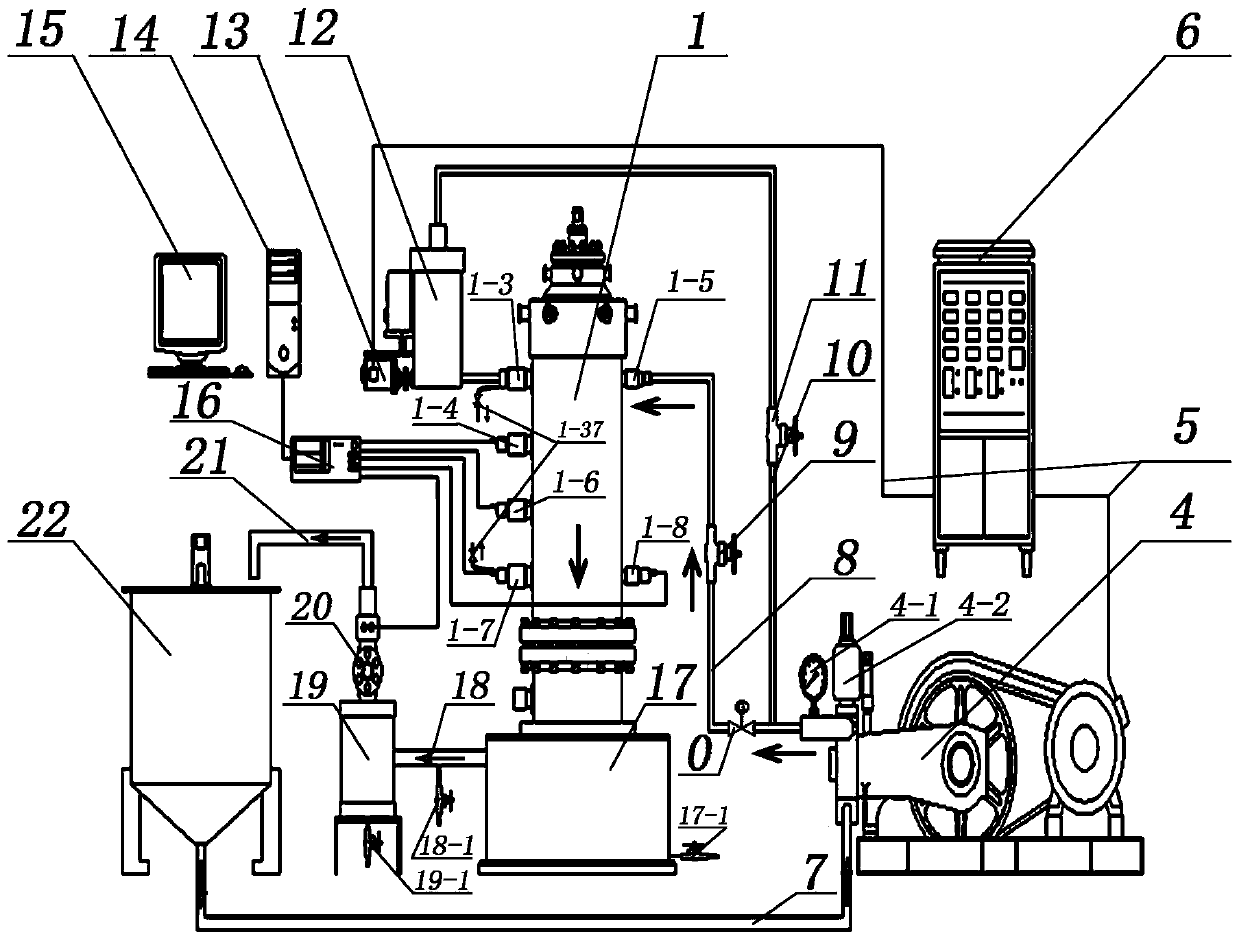
[0050] Example 1: Transparent Test Wellbore 1 Annulus Filling Experiment
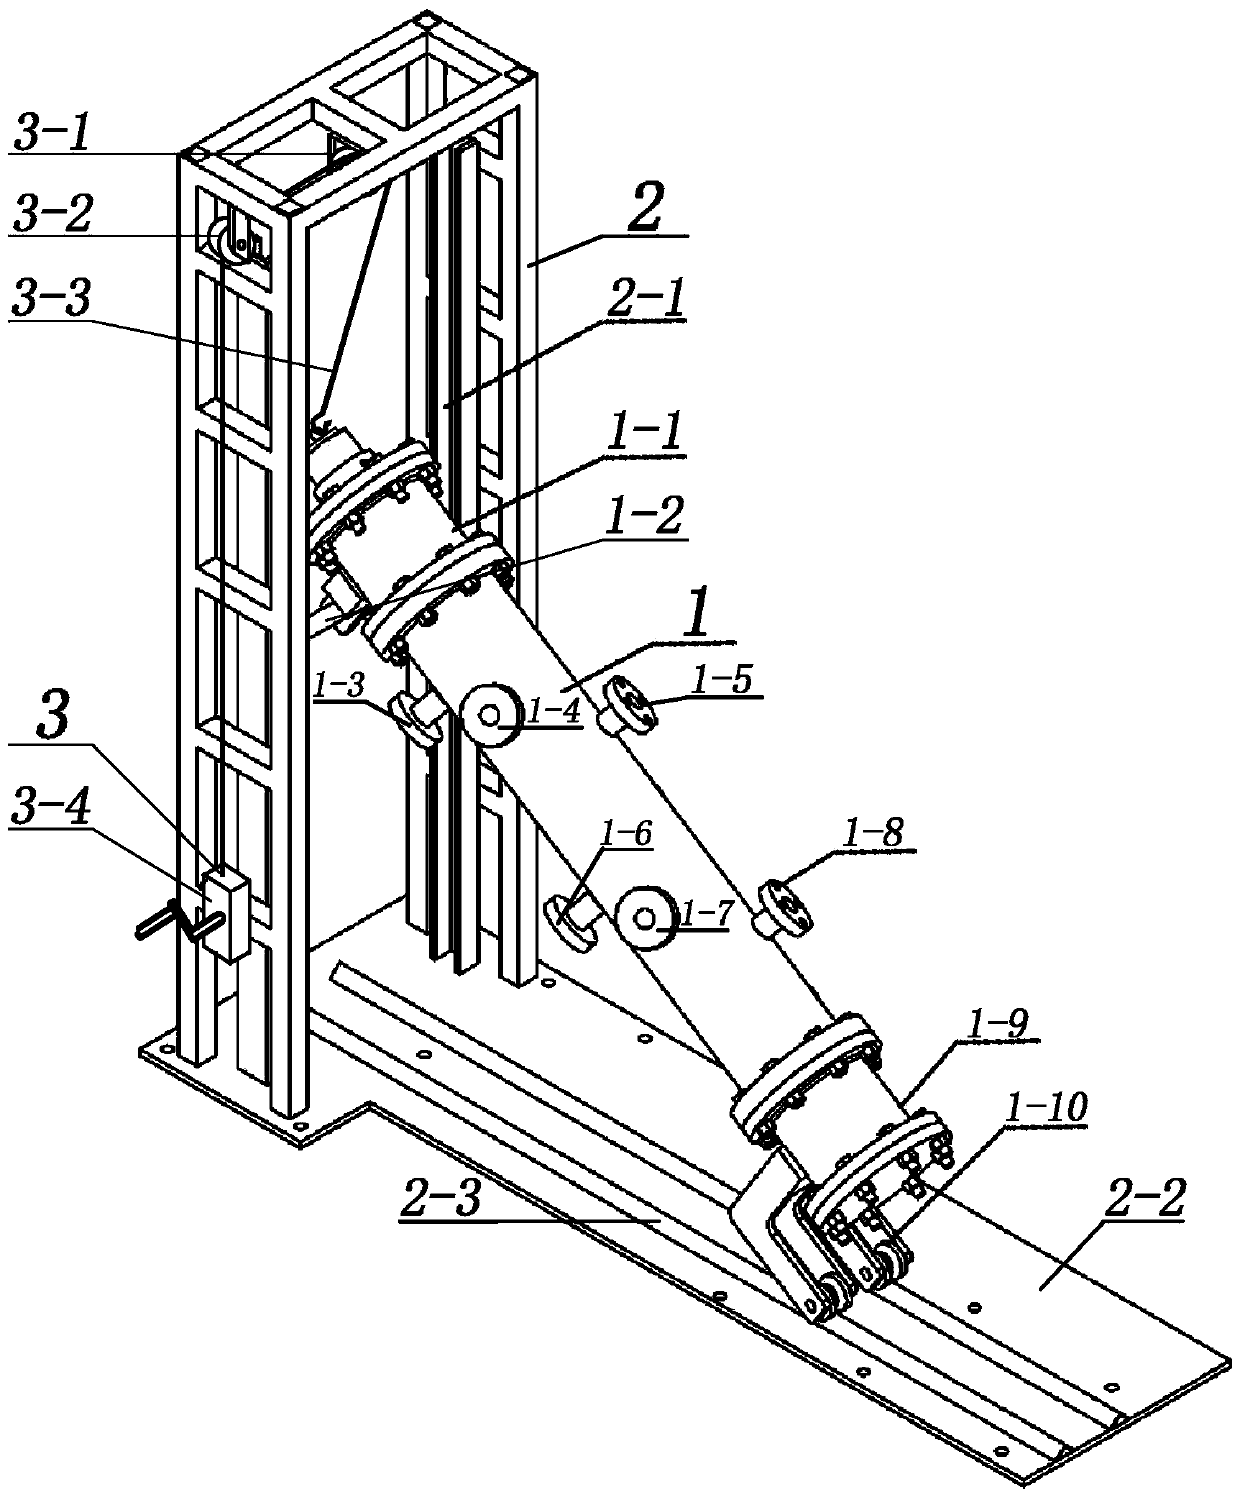
[0051] In this embodiment, in the step 1, the sand control pipe is placed in the transparent test wellbore 1, and the transparent test wellbore 1 is adjusted to a vertical state; a dead plug is installed on the sand filling hole and clamped; the outlet pipeline is connected;
[0052] In said step 2, open the sand mixing tank 12, put the pre-measured ring filling sand into the sand mixing tank 12 and clamp the sand filling port, and adjust the sand adding speed according to the expected sand carrying ratio, and the sand carrying ratio should be slowly increased To the expected value, and adjust according to pressure and flow changes at any time; when the pressure rises, the sand-carrying ratio should be quickly reduced according to the pressure change until the sand is stopped and replaced.
[0053] Draw the time-flow and pressure-flow curves according to the data recorded in the seepage experiment.
Embodiment 2
[0054] Embodiment 2: Sand control seepage experiment
[0055] In this embodiment, in the step 2, firstly add the well-wetted formation sand into the transparent test wellbore 1 until it is filled and solid;
[0056] In the step 3, the transparent test shaft 1 is blocked and clamped, and the starting pressure of the pressure relief valve is adjusted.
[0057] Start the high-pressure plunger pump 4 to perform the seepage test. After the pressure is stable, collect a set of data according to the seepage test record sheet. Increase the starting pressure of the pressure relief valve step by step. After the pressure is stable, collect the second set of data according to the seepage test record sheet. Increase the starting pressure of the pressure relief valve step by step. After the pressure is stable, collect the third set of data according to the seepage test record sheet. (The collected data shall not be less than 3 groups, each group shall not be less than 5 flow values, and t...
Embodiment 3
[0059] Example 3: Clay plugging seepage experiment
[0060] In the step 3, without changing the cycle state of the sand control seepage test, take 10% of the formation sand amount of clay, and evenly add it to the liquid storage tank 22. After the pressure is stable, continue the cycle for 2 weeks.
[0061] A set of data is collected according to the seepage experiment record sheet. Stop the pump to release the pressure, the stabilization time is not less than 24h, and then repeat the above steps.
[0062] Check whether there is formation sand in the tested pipe and take samples. Draw the time-flow and pressure-flow curves according to the data recorded in the seepage experiment.
PUM
 Abstract
Description
Claims
Application Information
 - R&D
- Intellectual Property
- Life Sciences
- Materials
- Tech Scout
- Unparalleled Data Quality
- Higher Quality Content
- 60% Fewer Hallucinations
Browse by: Latest US Patents, China's latest patents, Technical Efficacy Thesaurus, Application Domain, Technology Topic, Popular Technical Reports.
© 2025 PatSnap. All rights reserved.Legal|Privacy policy|Modern Slavery Act Transparency Statement|Sitemap|About US| Contact US: help@patsnap.com


