Low-dimensional parallel coordinate graph construction method based on Isomap algorithm layout
A technology of parallel coordinates and construction methods, applied in the field of visualization, can solve problems such as difficulty in obtaining information
- Summary
- Abstract
- Description
- Claims
- Application Information
AI Technical Summary
Problems solved by technology
Method used
Image
Examples
Embodiment 1
[0074] A method for constructing a low-dimensional parallel coordinate graph based on the Isomap algorithm layout, comprising the following steps:
[0075] Step S1, using the Isomap algorithm to perform dimension correlation calculation and layout;
[0076] Step S1.1 data preprocessing;
[0077] Data cleaning, filling missing values, building a data set, and treating the values of the data set dimensions as vectors;
[0078] There are n samples in the data set D, and the attributes of the samples are m-dimensional, then the data set D and the i-th item a i Expressed as:
[0079] D={a 1 ,a 2 ,...,a n}
[0080] a i ={v i1 ,v i2 ,...,v im}
[0081] Among them, v ij Indicates the j-th dimension value of the i-th item;
[0082] Treating each numeric dimension as a vector gives:
[0083] D = {d 1 ,d 2 ,...,d m}
[0084] d j ={v 1j ,v 2j ,...,v nj}
[0085] Among them, d j Indicates the jth dimension, and n is the number of samples.
[0086] Step S1.2 calcu...
Embodiment 2
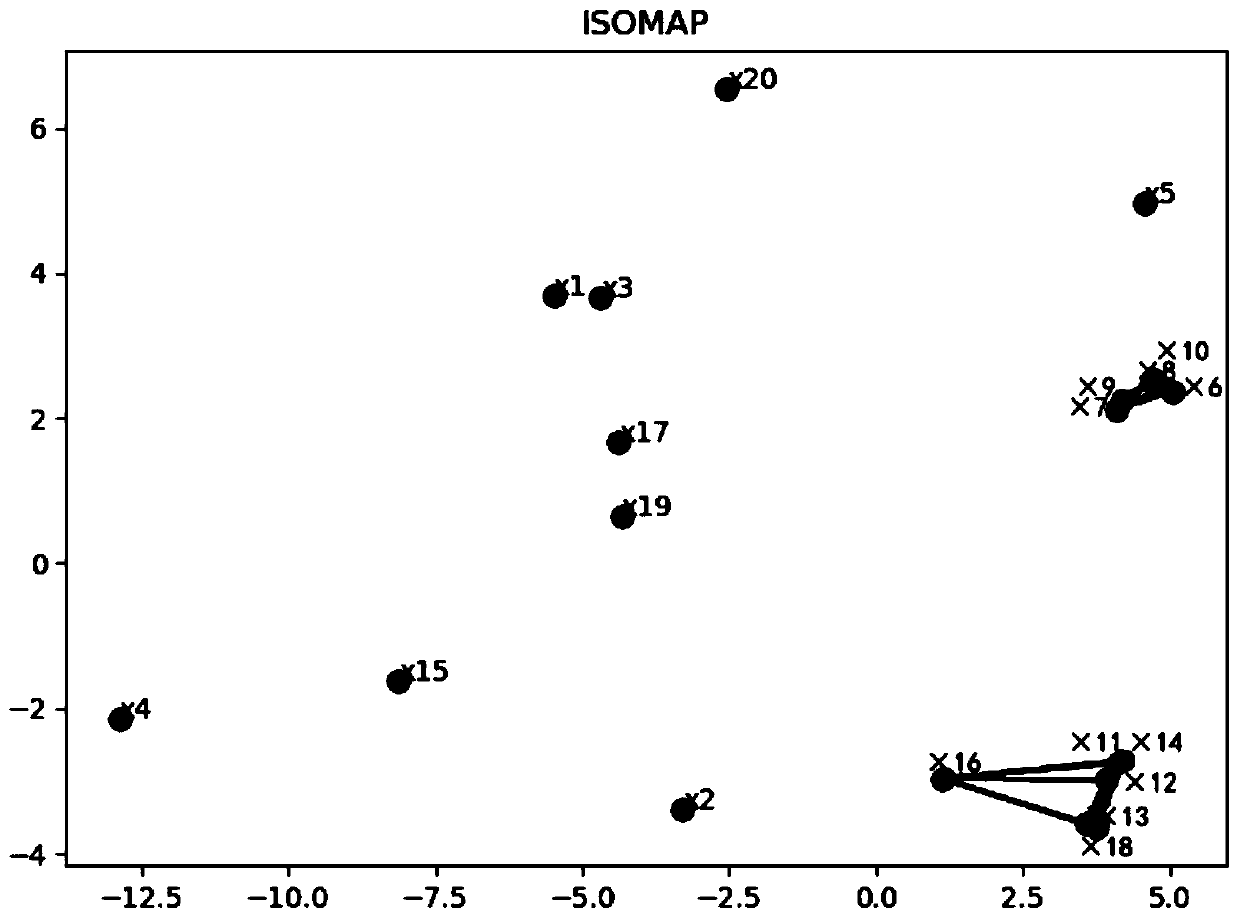
[0118] The data in this example comes from the image segmentation dataset in the UCI machine learning repository. The data selected 7 different outdoor pictures, and each picture was manually divided into 30 pieces, and 20 metric values were selected to form a data set containing 210 pieces of images with 20 feature values. In this embodiment, each image is regarded as a class, the feature value is regarded as a dimension, and each segmented image is regarded as a sample. A dataset of 210 samples in 20 dimensions is formed.
[0119] The data is normalized according to the dimensions, and the 20 dimensions of the data set are regarded as 20 vectors, which are laid out on a two-dimensional plane using the Isomap algorithm, and the threshold is selected according to the requirements.
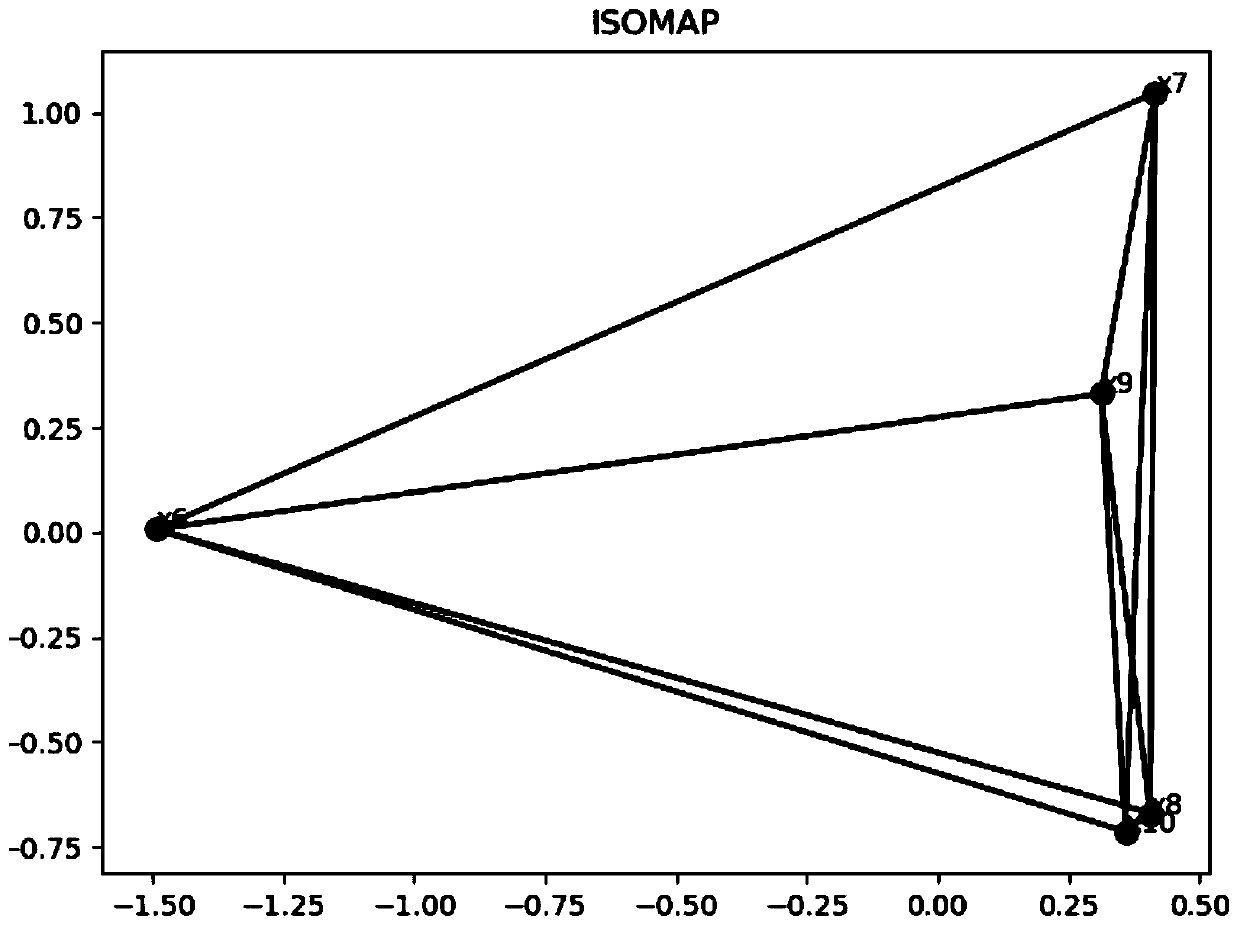
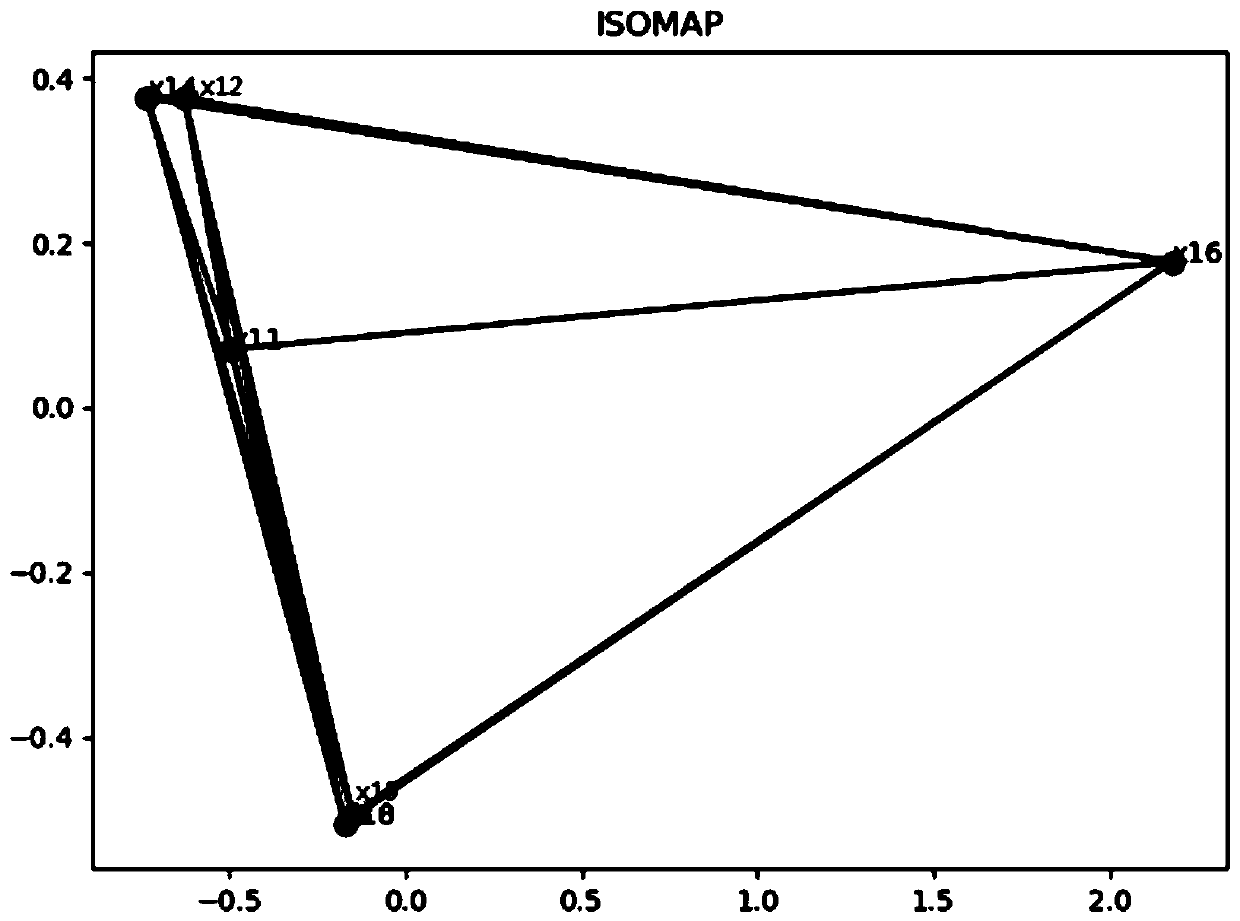
[0120] For the clarity of the layout results, the dimensions are identified as X1 to X20. The data layout and dimension set selection results are attached figure 1 As shown in the figure. Dep...
Embodiment 3
[0136] Data source for this example: Medical data Informatics is an increasingly important research field in healthcare, and visualization can improve the verifiability of data by showing that combinations of related dimensions correspond to specific clinical outcomes. The data in this example comes from the medical data set of early chronic kidney disease of UCI. The data is collected from the Apollo Hospital in India, with a total of 400 data samples. Among them, 250 samples were patients and 150 samples were non-patients. The data set includes 24 indicator features, 13 types of categorical variables and 11 types of numerical variables. After completing the missing values in the data set, the preprocessing is completed. Finally, a data set of 24 dimensions with 400 samples is obtained.
[0137] Since the Isomap algorithm is based on the MDS and uses the shortest path algorithm, the distance between each dimension is changed from the Euclidean distance to the long distan...
PUM
 Abstract
Description
Claims
Application Information
 - R&D
- Intellectual Property
- Life Sciences
- Materials
- Tech Scout
- Unparalleled Data Quality
- Higher Quality Content
- 60% Fewer Hallucinations
Browse by: Latest US Patents, China's latest patents, Technical Efficacy Thesaurus, Application Domain, Technology Topic, Popular Technical Reports.
© 2025 PatSnap. All rights reserved.Legal|Privacy policy|Modern Slavery Act Transparency Statement|Sitemap|About US| Contact US: help@patsnap.com


