
Webpage display method, module and system for lithofacies classification by using artificial intelligence

An artificial intelligence, web page display technology, applied in user interface execution, biological neural network model, website content management, etc., can solve the problem of texture analysis not being guided, and achieve the effect of improving user experience and increasing computing speed.

Pending Publication Date: 2020-08-28
SHANDONG YINGCAI UNIV
View PDF9 Cites 16 Cited by
  • Summary
  • Abstract
  • Description
  • Claims
  • Application Information

AI Technical Summary

Problems solved by technology

These methods also did not use an interactive training program, and texture analysis was not guided

Method used


Image

  • Webpage display method, module and system for lithofacies classification by using artificial intelligence
  • Webpage display method, module and system for lithofacies classification by using artificial intelligence
  • Webpage display method, module and system for lithofacies classification by using artificial intelligence

Examples


Embodiment Construction

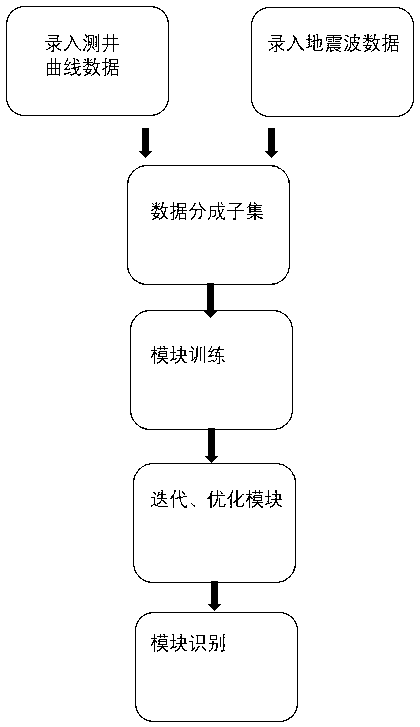
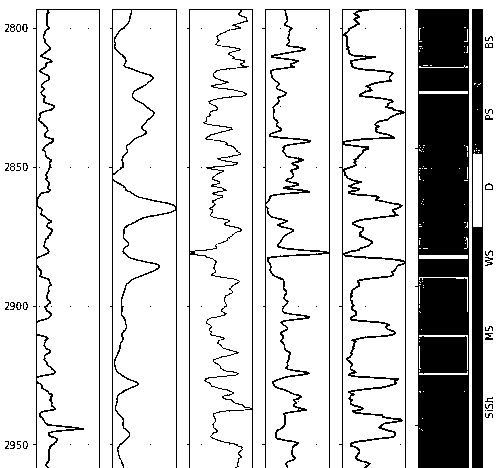
[0109] This example demonstrates the prediction of lithofacies from well log data. The dataset used here is log data from nine wells that have been labeled with lithofacies types based on observations from cores. We will use this test data to train a support vector machine to classify lithofacies types. A Support Vector Machine (or SVM) is a supervised learning model that can be trained on data to perform classification and regression tasks. The SVM algorithm uses the training data to best fit between different categories with a hyperplane. We will implement it using SVM in scikit-learn.

[0110] The first step is to organize the data set: load the training data of 9 wells, create a cross plot to view the changes in the data, and use the cross-validation set for model parameter selection.

[0111] The second step is to build and adjust the classifier: apply the trained model to classify the facies in unlabeled wells. Here, the classifier is applied to two wells. In the futu...


PUM


Abstract

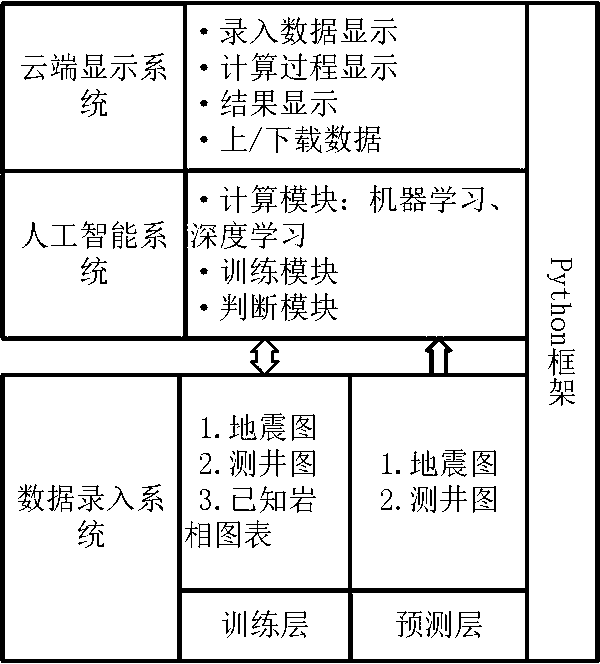
The invention discloses a method for interpreting logging curve and seismic map data by using artificial intelligence, and data entry and result output are both displayed in the form of a network page, so that remote deployment and data sharing are facilitated. The method comprises the steps that a part of collected sample data sets of known lithofacies classification are used as training data, automatic identification of lithofacies is carried out by using machine learning and deep learning methods, and then the lithofacies in stratums of unknown regions is divided. The invention comprises anartificial intelligence interpretation method, module and system. The server deployed with the method displays the following functions: a mutual communication interface of a webpage end comprises a data entry part, a data verification part, a data preprocessing part, a model establishment part, a model training part, a model iteration part, a model use part, a result display part and the like. According to the method, the calculation result of artificial intelligence is displayed on a network page by using a Python framework.

Description

[0001] The invention discloses a method for interpreting logging curves and seismogram data with artificial intelligence, and the data entry and result output are all displayed in the form of web pages, which is convenient for cloud computing operations, cloud server deployment, and cloud data aggregation. The security, confidentiality, storage, and sharing of classes and calculation results. The log curve data here refers to the physical properties of underground formation rocks, formation fluids and their mixtures; the seismogram here refers to two-dimensional, three-dimensional, four-dimensional and multi-dimensional data sets obtained by artificially launching seismic waves. The invention includes using a part of collected sample data sets with known facies classification as training data, and using a deep learning method to identify petrographic facies. To divide the lithofacies in the stratum, the layer thickness of the division and recognition ranges from 15 cm to hundred...

Claims


Application Information

Patent Timeline
Patent Type & Authority Applications(China)
IPC IPC(8): G06F9/451G06F16/958G06N3/04
CPCG06F9/451G06N3/047
Inventor 苗和平高端民赵红艳
Owner SHANDONG YINGCAI UNIV
Learn More