A method for automatic generation of main girder disease expansion diagram of girder bridge

A technology for automatically generating and unfolding diagrams, applied to bridges, buildings, geometric CAD, etc., can solve the problems of wrong relative relationship between disease sizes, cumbersome, insufficient support for automatic generation of disease development diagrams, etc., and achieve the effect of improving drawing efficiency

Active Publication Date: 2022-06-28
山西省交通科技研发有限公司
View PDF6 Cites 0 Cited by
  • Summary
  • Abstract
  • Description
  • Claims
  • Application Information

AI Technical Summary

Problems solved by technology

[0002] The expansion diagram of beam bridge damage is used to show the distribution of different types of damage in the components, as well as the approximate size of the damage. Generally, it is manually drawn in AutoCAD software based on the damage pictures taken on site, and the data is entered twice, and the workload is heavy and cumbersome. , a high probability of error
[0003] The realization of bridge disease information collection technology realizes the direct upload of disease on-site collection, and the automatic generation of inspection reports after database analysis and processing, but the information entered in the conventional on-site collection program can only realize that the disease information can be listed one by one in the report in tables or other fixed forms , not enough to support the automatic generation of disease expansion diagram
In addition, some applications support manual insertion of disease and its characteristic information in the form of lines and planes in specific bridge structure expansion diagrams and then display them in the inspection report. However, the drawing of disease schematic diagrams still relies on manual labor, although the drawing speed is greatly improved compared with traditional methods. However, it still cannot be automated by relying on manual drawing, and the relative relationship of disease size is wrong

Method used


Image

  • A method for automatic generation of main girder disease expansion diagram of girder bridge
  • A method for automatic generation of main girder disease expansion diagram of girder bridge
  • A method for automatic generation of main girder disease expansion diagram of girder bridge

Examples


Embodiment 1

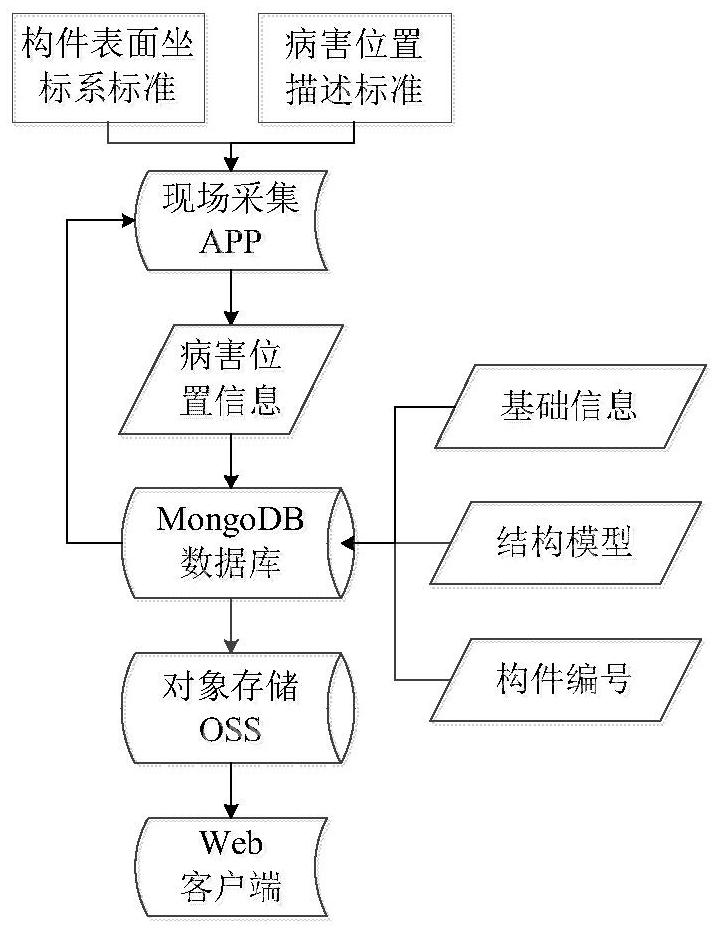
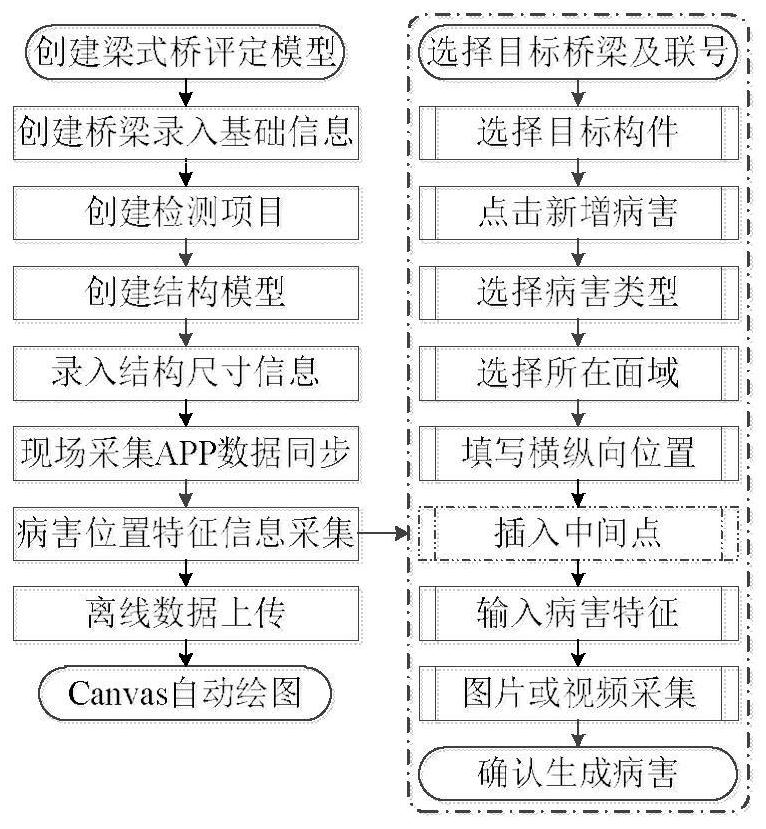
[0032] The method for automatically generating an expanded view of the main girder disease of a girder bridge provided by the present invention includes 6 steps of internal operation (S1-S5, S9, the first step can be omitted in normal use), and three steps of field operation:

[0033] S1: According to the "Technical Condition Assessment Standard for Highway Bridges" (JTG / T H21-2011), a beam bridge assessment model is created through the Web client, including the bridge name, components, subcomponents, and possible disease types of the subcomponents, and configure each Whether the sub-component needs to enter the horizontal and vertical position information when collecting the disease position information;

[0034] S2: The web client creates a bridge, and enters the bridge name and other necessary basic information;

[0035] S3: The Web client creates inspection projects, so that inspectors of different projects can use the on-site collection APP to obtain the corresponding bri...


PUM


Abstract

The invention discloses a method for automatically generating the disease expansion diagram of the main girder of a girder bridge, which includes: establishing the component surface coordinate system standard, setting the default coordinate system and origin position of the main girder component; and controlling the disease position description standard in the default coordinate system Point coordinate calculation; on-site collection APP is developed according to the disease location description standard, and is oriented to MongoDB database, object storage OSS communication data; MongoDB database stores basic information of bridges and other data; object storage OSS stores generated expansion diagrams, and provides links for easy reference; The web client accesses and edits the MongoDB database, enters the information required for bridge disease investigation and assigns detection tasks, and automatically generates a disease expansion diagram. On the basis of component surface coordinate system standards and disease location description standards, the invention relies on MongoDB database, object storage OSS to develop Web client, and field collection APP, realizes automatic generation of disease expansion diagram, and solves the work of secondary data entry and manual drawing The problem of large volume and high error rate.

Description

technical field [0001] The invention belongs to the technical field of bridge engineering, and particularly relates to a method for automatically generating an expanded view of a main girder disease of a girder bridge. Background technique [0002] The beam bridge disease expansion map is used to show the distribution of different types of diseases in the components and the approximate size of the diseases. It is generally drawn manually in AutoCAD software according to the disease pictures taken on site, which is a secondary data entry, and the workload is large and cumbersome. , the probability of error is high. [0003] The bridge disease information collection technology is realized, which realizes the direct upload of the disease site collection, and the database analysis and processing automatically generates the test report, but the information entered in the conventional field collection program can only realize the disease information in the report. , which is not ...

Claims


Application Information

Patent Timeline
Patent Type & Authority Patents(China)
IPC IPC(8): G06F30/13G06F30/12E01D2/00E01D2/04
CPCG06F30/13G06F30/12E01D2/00E01D2/04
Inventor 赵晓晋张雷陈栋栋彭小庆史文秀杜光郭学兵张子良
Owner 山西省交通科技研发有限公司
Why Eureka
Try Eureka